Recently, the business has grown rapidly, which is also a big challenge for our background. The performance bottleneck of the core business interface encountered this time is not caused by a single problem, but a combination of several problems: after we solve one, we launch it, and then we find another performance bottleneck. This is also my lack of experience, which leads to my failure to locate and solve it all at once; And I have stubborn self-esteem for our whole backstage team. I don't want to survive the pressure peak through a large number of horizontal expansion, resulting in different degrees of problems online for several consecutive nights, which must have an impact on our business growth. This is also where I am immature and want to reflect. This series of articles mainly record the general technical optimization of our background micro service system for this business growth, and the optimization of business process and cache. Since it is only applicable to our business, it will not be repeated here. This series will be divided into the following articles:
- Improved client load balancing algorithm
- Develop a filter plug-in for the log output exception stack
- Improving asynchronous log waiting strategy for x86 cloud environment
- To increase the monitoring of HTTP request waiting queue of synchronous microservices and cloud deployment, we need to be careful that the request response is slow due to reaching the upper limit of instance network traffic
- Add necessary intrusive monitoring for key business of the system
Add monitoring for HTTP request waiting queue of synchronous microservice
Problems of synchronous microservice in request timeout
Compared with the asynchronous microservice based on spring weblux, the synchronous microservice based on spring webmvc does not handle the situation that the client has request timeout configuration well. When the client request times out, the client will directly return a timeout exception, but the invoked server task is not cancelled in the spring webmvc based synchronous microservice, and the spring weblux based asynchronous microservice will be cancelled. At present, there is no good way to cancel these timed out tasks in a synchronous environment.
Our spring webmvc based synchronous microservice uses Undertow as the HTTP container. In the spring boot environment, we can configure the thread pool size for processing HTTP requests:
server:
  undertow:
    # The following configurations will affect buffer s, which will be used for IO operations of server connections
    # If you apply for ByteBuffer every time you need it, you need to go through the JVM memory allocation process (TLAB - > heap) for heap memory and system call for direct memory, which is very inefficient.
    # Therefore, memory pools are generally introduced. Here is' BufferPool '.
    # At present, there is only one 'DefaultByteBufferPool' in UnderTow, and other implementations are useless at present.
    # The DefaultByteBufferPool is very simple compared to the ByteBufArena of netty, similar to the mechanism of JVM TLAB
    # For bufferSize, it is better to configure it the same as the TCP Socket Buffer configuration of your system
    # `/proc/sys/net/ipv4/tcp_rmem ` (for read)
    # `/proc/sys/net/ipv4/tcp_wmem ` (for write)
    # When the memory is greater than 128 MB, the bufferSize is 16 KB minus 20 bytes, which are used for the protocol header
    buffer-size: 16364
    # Whether to allocate the direct memory (the off heap memory directly allocated by NIO) is enabled here, so the java startup parameter needs to configure the direct memory size to reduce unnecessary GC
    # When the memory is greater than 128 MB, direct memory is used by default
    directBuffers: true
    threads:
      # Set the number of IO threads, which mainly perform non blocking tasks. They are responsible for multiple connections. By default, one read thread and one write thread are set for each CPU core
      io: 4
      # Block the task thread pool. When performing IO blocking operations similar to servlet requests, underow will get threads from this thread pool
      # Its value setting depends on the blocking coefficient of system threads executing tasks. The default value is IO threads * 8
      worker: 128
The thread pool behind it is the JBoss thread pool: org.jboss.threads.EnhancedQueueExecutor. At present, spring boot cannot modify the queue size of this thread pool through configuration. The default queue size is Integer.MAX
We need to monitor the queue size of this thread pool and do some operations for this indicator:
- When this task continues to increase, it means that the request processing can not keep up with the arrival rate of the request, and an alarm is needed.
- When a certain number is accumulated, the instance needs to be temporarily removed from the registry and expanded.
- After this queue is consumed, go online again.
- If the consumption is not completed after a certain period of time, restart the instance.
Add synchronous microservice HTTP request waiting queue monitoring
Fortunately, org.jboss.threads.EnhancedQueueExecutor itself exposes various indicators of the thread pool of HTTP servlet requests through JMX:
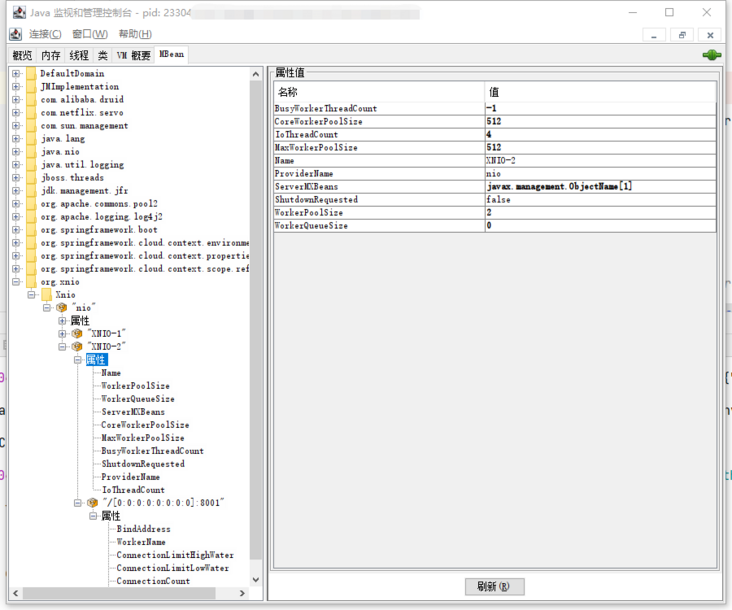
In our project, two kinds of monitoring are used:
- prometheus + grafana micro service indicator monitoring, which is mainly used to alarm and quickly locate the root cause of the problem
- JFR monitoring is mainly used to locate single instance problems in detail
For HTTP request waiting queue monitoring, we should expose it to grafana through the prometheus interface, collect indicators and improve response operations.
The codes that expose prometheus interface indicators are:
@Log4j2
@Configuration(proxyBeanMethods = false)
//It needs to be loaded when prometheus is introduced and the actor exposes the prometheus port
@ConditionalOnEnabledMetricsExport("prometheus")
public class UndertowXNIOConfiguration {
    @Autowired
    private ObjectProvider<PrometheusMeterRegistry> meterRegistry;
    //Initialize only once
    private volatile boolean isInitialized = false;

    //You need to register after the ApplicationContext is refreshed
    //The log configuration is initialized before the ApplicationContext is loaded
    //However, the loading of related beans of prometheus is complex, and there are many changes with the version change, so we are lazy and register after the entire ApplicationContext is refreshed
    // ApplicationContext may refresh multiple times, such as calling / Actor / refresh, and there are multiple ApplicationContext scenarios
    // For simplicity, a simple isInitialized is used to determine whether it is the first initialization, and ensure that it is initialized only once
    @EventListener(ContextRefreshedEvent.class)
    public synchronized void init() {
        if (!isInitialized) {
            Gauge.builder("http_servlet_queue_size", () ->
            {
                try {
                    return (Integer) ManagementFactory.getPlatformMBeanServer()
                            .getAttribute(new ObjectName("org.xnio:type=Xnio,provider=\"nio\",worker=\"XNIO-2\""), "WorkerQueueSize");
                } catch (Exception e) {
                    log.error("get http_servlet_queue_size error", e);
                }
                return -1;
            }).register(meterRegistry.getIfAvailable());
            isInitialized = true;
        }
    }
}
After that, we can see the corresponding indicators by calling /actuator/prometheus.
# HELP http_servlet_queue_size
# TYPE http_servlet_queue_size gauge
http_servlet_queue_size 0.0
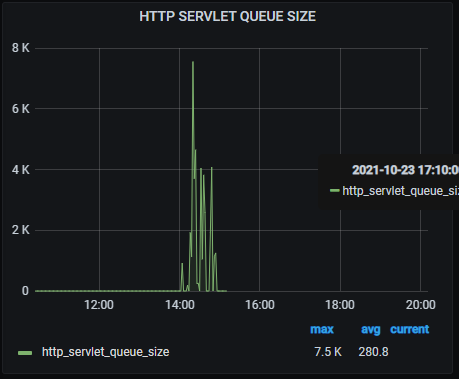
When queue accumulation occurs, we can quickly alarm and intuitively find out from grafana monitoring:
For public cloud deployment, pay attention to the monitoring of network restrictions
The current public cloud will virtualize the physical machine resources and the network card resources. Taking AWS as an example, the virtualization implementation of its network resources is ENA (Elastic Network Adapter). It will monitor and limit the following indicators:
- Bandwidth: each virtual machine instance (each EC2 instance in AWS) has the maximum bandwidth of outgoing traffic and incoming traffic. This statistics uses a network I/O integration mechanism to allocate network bandwidth according to the average bandwidth utilization. The final effect is to allow the rated bandwidth to be exceeded in a short time, but not continuously.
- Number of packets per second (PPS): the size of PPS is limited for each virtual machine instance (each EC2 instance in AWS)
- Number of connections: the number of connections established is limited
- Link local service access traffic: generally, in the public cloud, each virtual machine instance (each EC2 instance in AWS) accesses DNS and metadata server, which will limit the traffic
At the same time, for mature public clouds, these indicators generally provide users with a display and analysis interface. For example, the CloudWatch of AWS provides the monitoring of the following indicators:
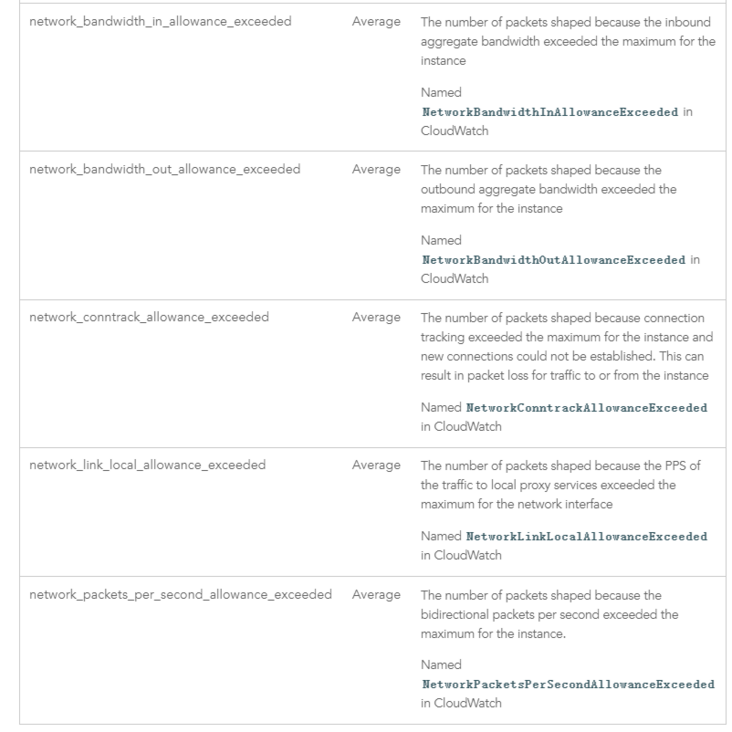
When the business traffic surged, we found that there was a performance bottleneck in accessing Redis through JFR, but the monitoring of Redis itself showed that it did not encounter a performance bottleneck. At this time, we need to check whether the problem is caused by network traffic restriction. During the period when the problem occurs, we find that the NetworkBandwidthOutAllowanceExceeded event has significantly improved:
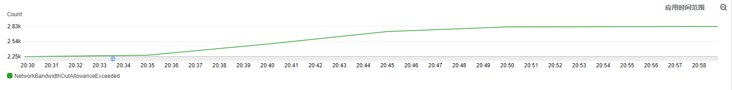
For this problem, you need to consider vertical capacity expansion (increasing instance configuration) and horizontal capacity expansion (multi instance load balancing), or reduce network traffic (increasing compression, etc.)
WeChat search "my programming meow" attention to the official account, daily brush, easy to upgrade technology, and capture all kinds of offer: