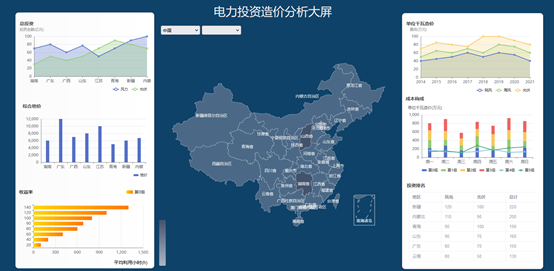
 As shown in the figure, when we develop a Web system, we often encounter the need to use maps for display. Under ordinary needs, we can use ecarts maps. If we use ecarts to develop maps, we need to find map data, call ecarts map API, configure styles, render data, etc. a map effect takes a lot of energy and time. Here we introduce that this function can be completed in a very short time by using the map component provided by SovitChart.
Operation process:
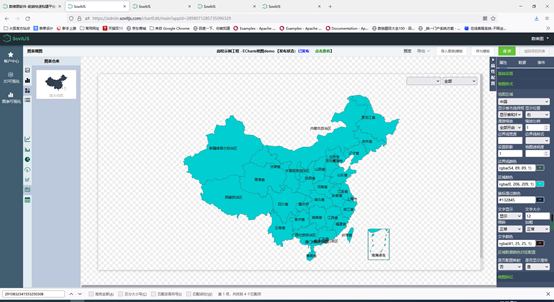
1. Log in to the data dimension diagram background and enter the SovitChart editor.
2. Chart component design in SovitChart
3. Select the map component, and then design the style and function of the map in the attribute panel
4. Configure dynamic data binding (the operator is set to compare the investment amount of each region. The display color is different for different amounts).
The JSON format definition effect of binding data with JSON data source:
[{
 "mapValue":"130000:100"
},{
 "mapValue":"150000:200"
}]
5. Publish map components and use them in your own business system (online integration or offline integration).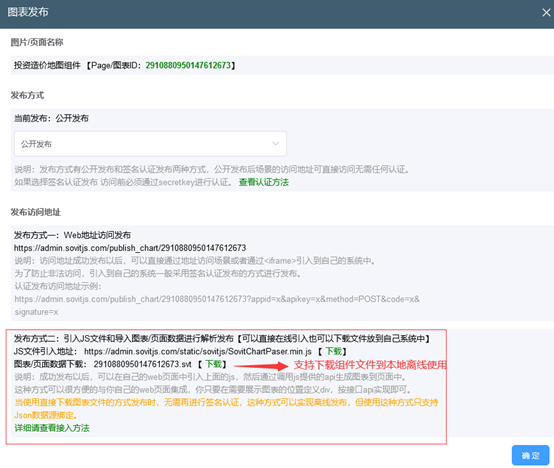
6. Integrate components into your own web page. The same component can be used in multiple pages.
//Reference SovitChart's js core library
<script src="https://admin.sovitjs.com/static/sovitjs/SovitChartPaser.min.js"></script>
//Define a div container and a unique id where you need to place the map on your web page
<!-- Create a div,Used to integrate maps -->
<div id="chart_map_1" style="width: 95%;height: 600px;">
</div>
//Reference components through the interface of js
<script>
	let sceneMain = null;
	//Note: jCanvasQuery is a JQuery component provided by the SovitChart core library, similar to $(). You can also use the JQuery library introduced by yourself
	jCanvasQuery(document).ready(function() {
		//Create a SovitChart parser object
		sceneMain = new SovitChartPaser.SceneMain({
			apiurl: 'https://admin.sovitjs.com/restapi',
			publishType: 1 //1 is an online reference component and 2 is an off reference component
		});
		//Import the chart and display it in the specified DIV
		sceneMain.initChart("chart_map_1", {
			pageId: "2910880950147612673" //The ID of the chart and the place where the chart is published can be found
		},function(type,reObj){
			if(type == "click") {
				console.log(type,reObj);
				alert("Click event test");
			}
		},function(id,type,reObj){
			if(type == "change") {
				console.log(id,type,reObj);
				alert("Select region drop-down test");
			}
		});
	});
</script>
design sketch: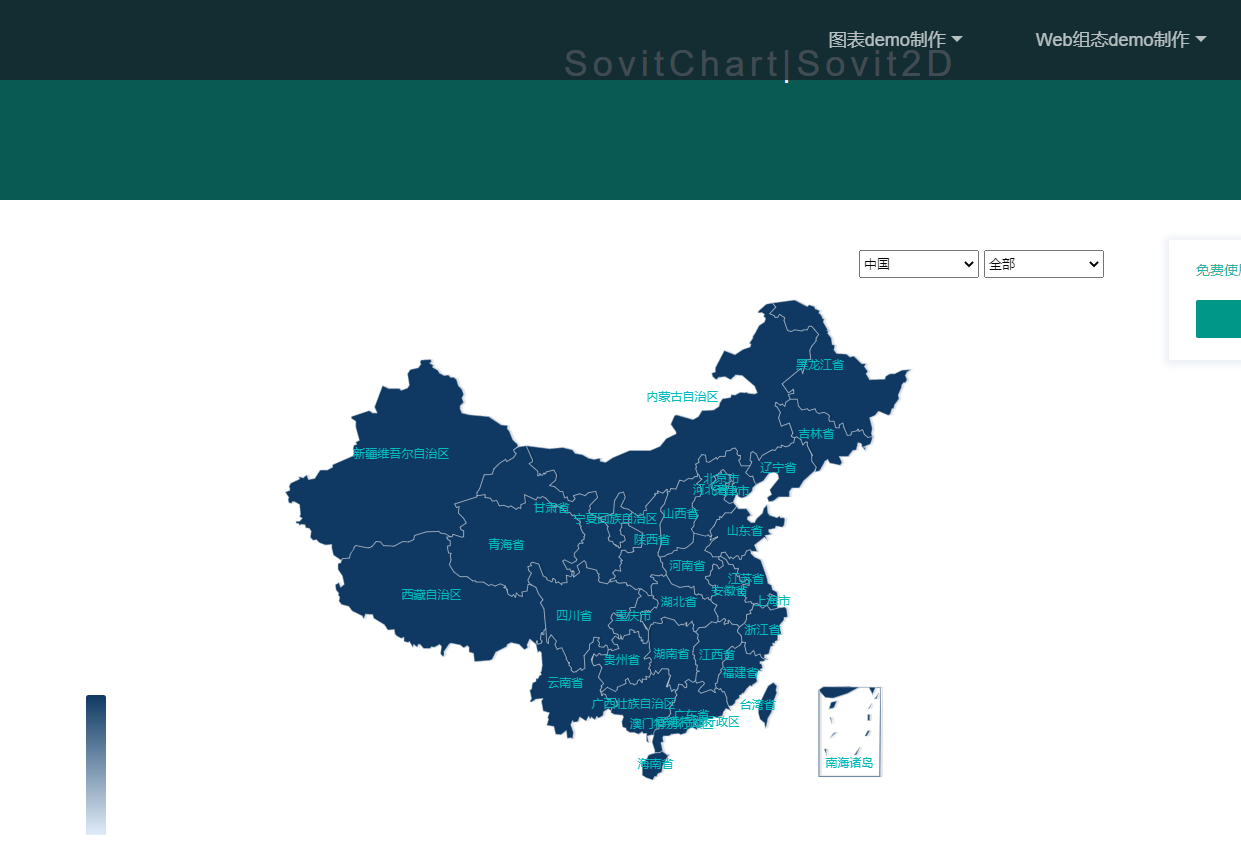
7. Interface instructions.
After the component is referenced into its own system, it can be started again through various interfaces provided by SovitChart. Specifically, the following work can be done:
- Obtain the component (map) object through the object returned by the function, and then modify the component, such as changing the style and adding other effects of ecarts.
let mapMain = sceneMain.initChart("chart_div_id", {
	pageId: "2805023880597471236",
}
mapMain Is the returned map object, which can be used after having this object echarts of api Make changes to the map.- By sending JSON data to the component, the data in the component can be changed dynamically.
sceneMain.sendJson("sovitjs_div_id","Json28980712857350963290001",json1);//The second parameter represents the number of the JSON data source defined when the chart page is bound to data- Obtain the mouse entry and click events of each area of the map through the callback function.
- Get the change event of the map drop-down box through the callback function (there are two callback functions in the following code, the first is the mouse event of the map, and the latter is the change event of the drop-down box).
sceneMain.initChart("chart_map_1", {
			pageId: "2910880950147612673" //The ID of the chart and the place where the chart is published can be found
		},function(type,reObj){
			if(type == "click") {
				console.log(type,reObj);
				alert("Click event test");
			}
		},function(id,type,reObj){
			if(type == "change") {
				console.log(id,type,reObj);
				alert("Select region drop-down test");
			}
});- Add a label interface to the map
let markJson = [{
				"code": "1001",
				"name": "Callout 1",
				"value": [119.04, 35.9423]
			},
			{
				"code": "1002",
				"name": "Callout 2",
				"value": [120.6774, 35.9263]
			}
		];
sceneMain.putMapMark("chart_div_id", markJson);- Switch maps by region code or name
sceneMain.changeMap("chart_div_id", "110000");//110000 Beijing codeFor more information, please refer to the official website documentation