What is jstack
- The main function of jstack is to view or export the stack information (snapshot) of java threads; Used for stack trace. When we use the jstack command, it will print out the call stack of methods in all threads in the specified process.
Thread snapshot is a collection of method stacks being executed by each thread in java virtual machine. The main purpose of generating thread snapshot is to locate the location of thread problems; Common problems are
- Long response time
- thread deadlock
- Dead cycle
When a thread pauses, you can check the call stack of each thread through jstack to know what the thread has done in the background and what resources are waiting for.
usage method
Command format
jstack [options] <pid>
options parameter description
jstack doesn't have many option parameters. Only three are really used. Let's introduce them one by one
--F: When a thread is suspended, using the jstack -l pid command will not print the stack information. Using - F can force the output of the thread stack; But it will stop
--l: In addition to the stack, the printed information also displays the additional information of the lock;
--m: Output stack information of java and C/C + + at the same time; In the java system class library, there are many methods modified by native. You can't see the source code of these methods modified by native at the java level, because these methods are implemented in C/C + +;
Status description
In the stack of threads, you should pay special attention to the following states:
- Deadlock: deadlock (focus)
- Waiting on condition: waiting for resources (focus)
- Waiting on monitor entry: wait to get the monitor (focus)
- Blocked: blocked (focus)
- Runnable: executing
- Suspended: suspended
- Object.wait() or TIME_WAITING: the object is waiting
- Parked: stop
no option parameter
Command without option parameter
jstack 12771
The printing results are as follows
# ... ignoring other stack information, we only focus on the stack of the main thread
"main" #1 prio=5 os_prio=31 tid=0x00007fee9101a000 nid=0x2903 runnable [0x00007000085aa000]
   java.lang.Thread.State: RUNNABLE
	at java.io.FileInputStream.readBytes(Native Method)
	at java.io.FileInputStream.read(FileInputStream.java:255)
	at java.io.BufferedInputStream.fill(BufferedInputStream.java:246)
	at java.io.BufferedInputStream.read(BufferedInputStream.java:265)
	- locked <0x000000076ab1ead0> (a java.io.BufferedInputStream)
	at com.test.Test.main(Test.java:12)
# ...... Ignoring other stack information, we only focus on the stack of the main thread
The analysis of each word in the first line,
- "main": thread name.
- prio: thread priority
- tid: refers to Java Thread id.
- nid: refers to the id of the native thread..
- [0x00007000085aa000]: start address of thread stack.
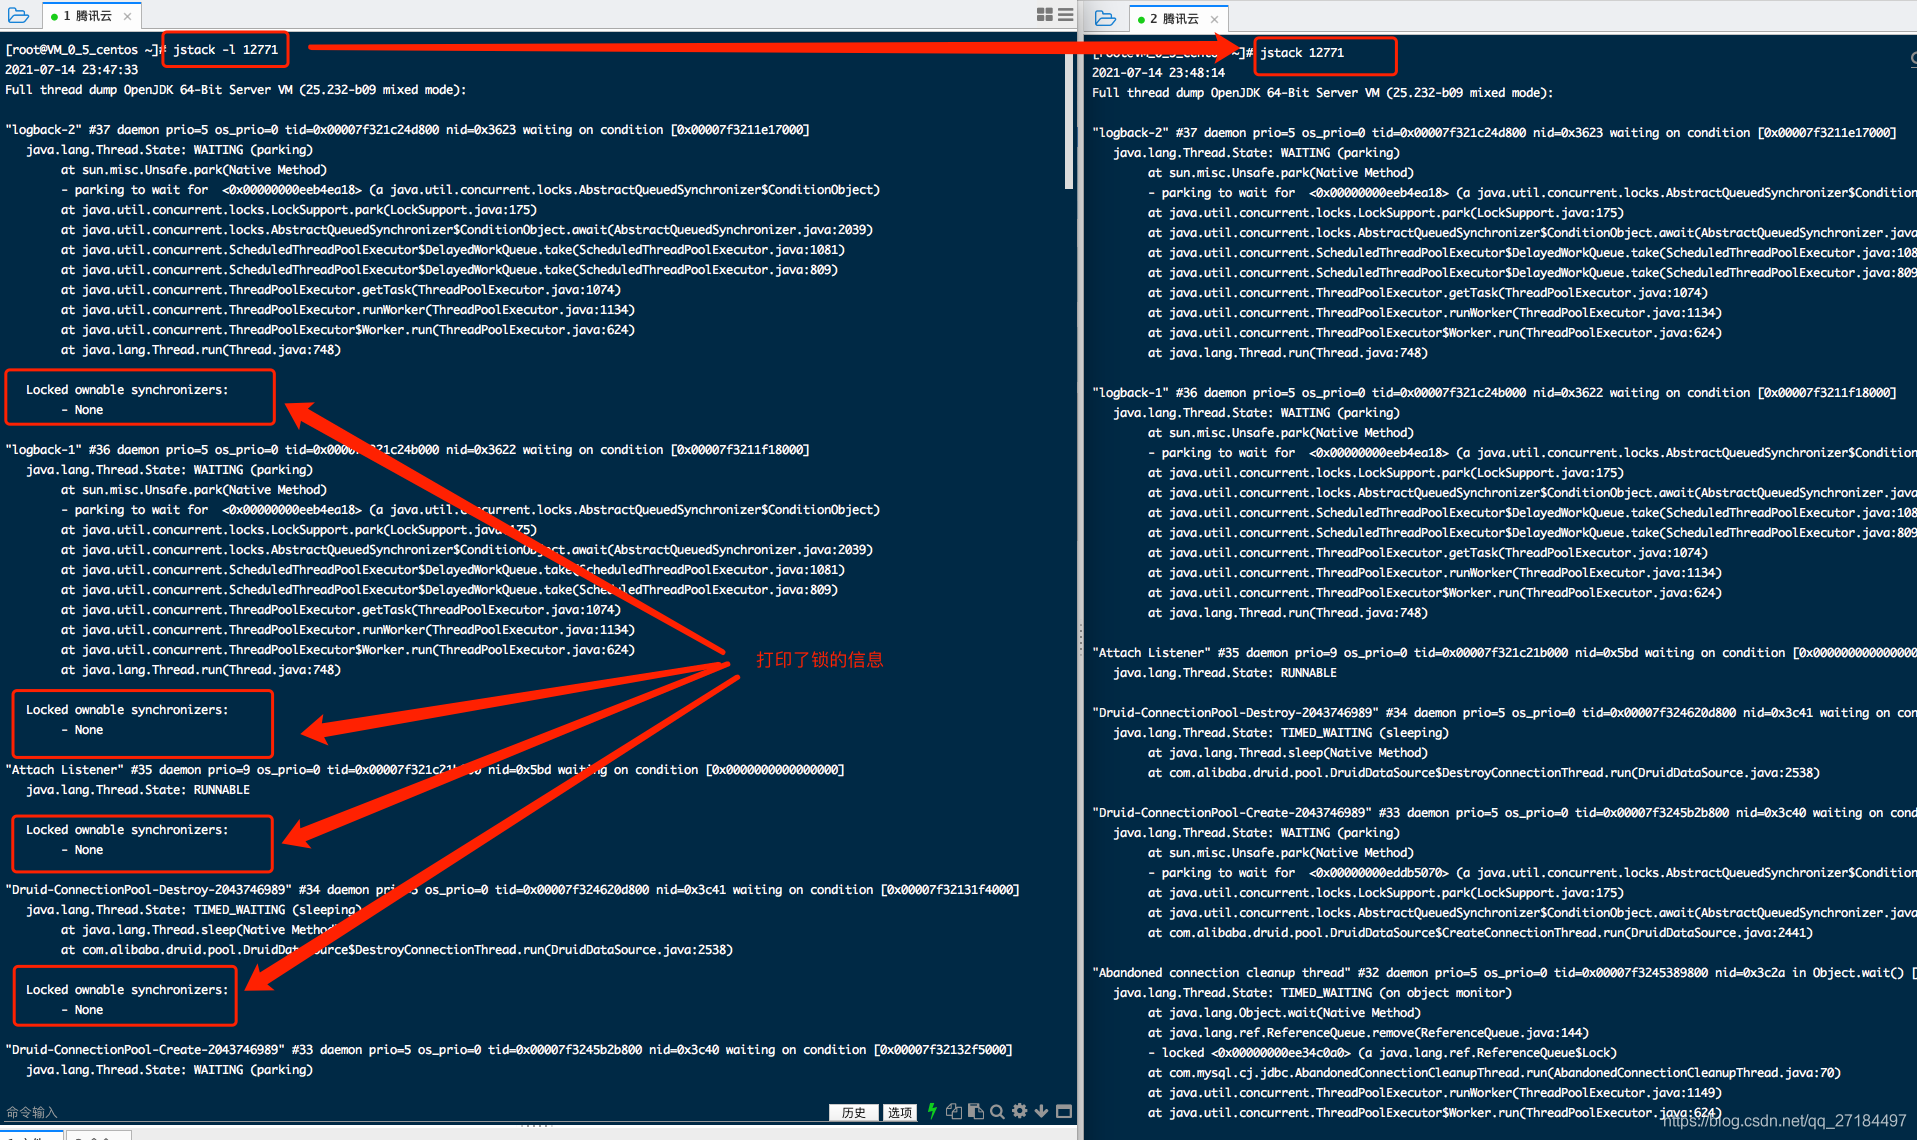
-l print additional information of lock
Here we use two windows and use the following two commands to test
# First window execution
jstack -l 12771

# Execute in the second window
jstack  12771
Through the comparison of the two windows, it can be seen that the command with - l prints more lock information;
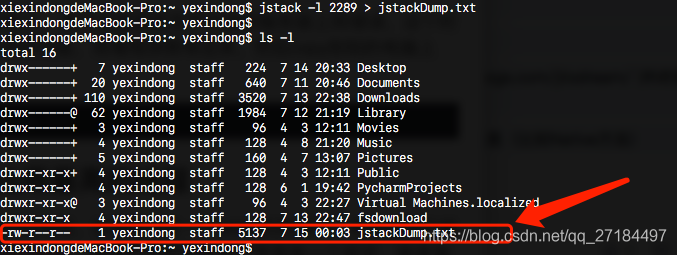
Export stack file
Generally, if the program makes an error, it will not directly find the error on the server of the production environment. At this time, a very practical function can be used to export the stack snapshot, and then copy it to another computer. The command is as follows
jstack -l 2289 > jstackDump.txt
After execution, you can see that the file has been exported
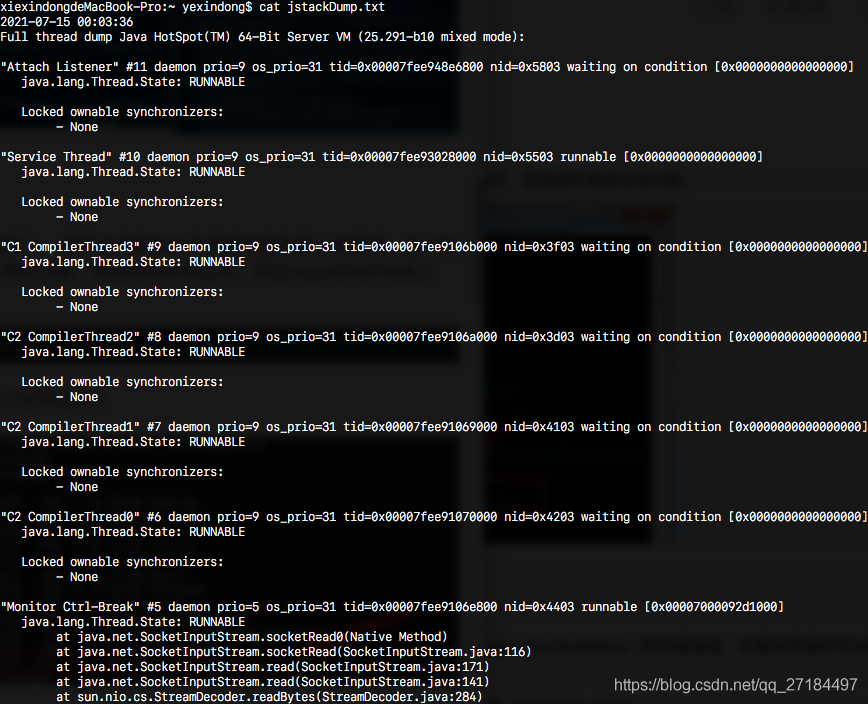
You can see through the cat command that the contents are the same as those we output on the command line
Practice 1. Find out the thread with the highest cpu consumption (linux system)
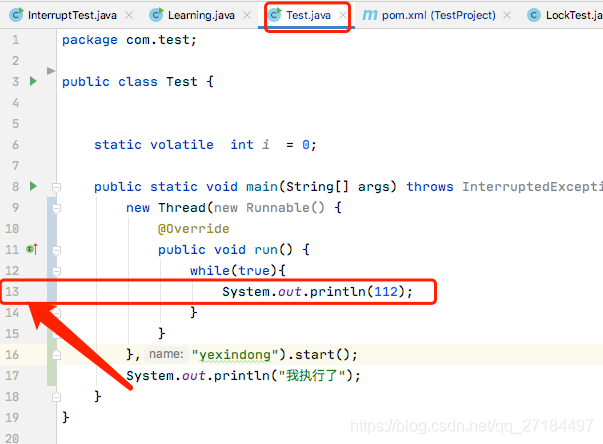
First of all, we prepare an endless loop thread, set a while endless loop in the thread, and give the thread a name: yexindon. Alibaba's development specification stipulates that each thread must have a name, which is to find errors when the program goes wrong in the future;
    public static void main(String[] args) throws InterruptedException {
        new Thread(new Runnable() {
            @Override
            public void run() {
                while(true){
                    System.out.println(112);
                }
            }
        },"yexindong").start();
        System.out.println("I did");
    }
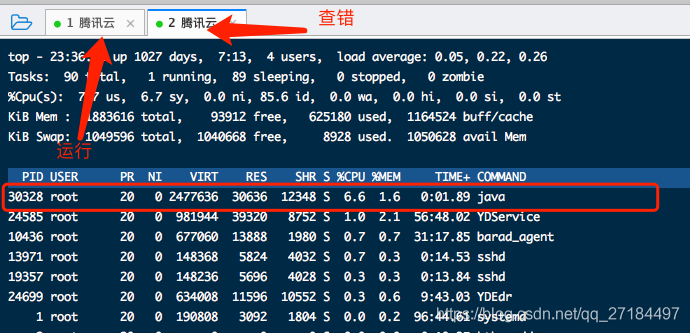
Then, we type this code into a jar package and throw it to the linux server to run. Directly enter the java -jar Test.jar command to run it. After running, we can see that the console has been outputting the character 112, which means that the program is already running;
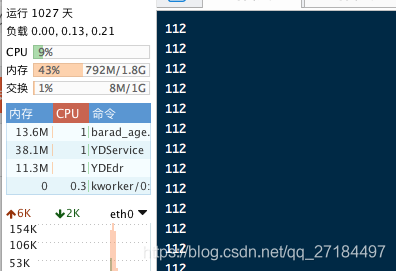
Then, check the CPU operation and use the top command to check the CPU utilization. The process with process number 30328 ranks first, accounting for 6.6% of the CPU; Here, I use two command lines to connect to the same server. One window is used to run the jar package just now, and the other window is used to find errors;
Find thread - the first way
Know the process number, and then find the thread. Enter the following command
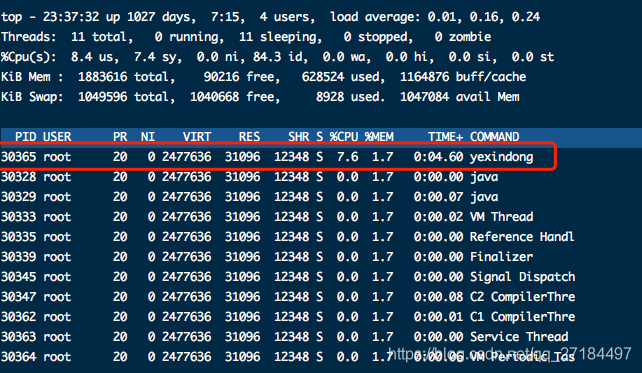
top -Hp 30328
The printing results are as follows. Here is a point to note. After adding the - Hp instruction, the PID display is the thread id. at this time, we see that the thread id occupying the highest CPU is 30365;
Find thread - second way
Another way is to use the ps command to find threads
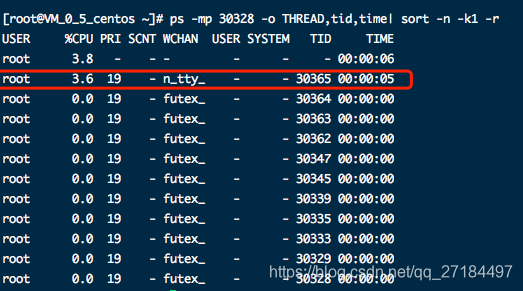
ps -mp 30328 -o THREAD,tid,time| sort -n -k1 -r
Through this command, we can see that the highest thread id is also 30365;
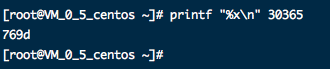
In the above way, we successfully found that the thread id with high cpu consumption is 30365, but this id is decimal. Here, we need to convert it to hexadecimal and enter the command
printf "%x\n" 30365
The corresponding hexadecimal is calculated as 769d
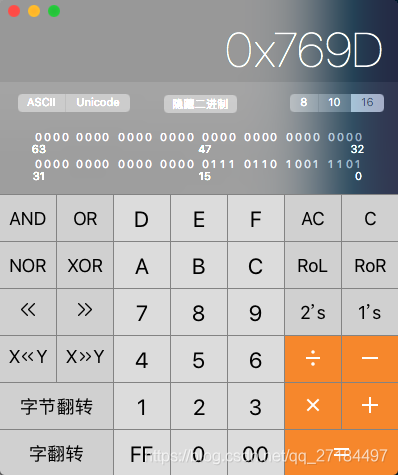
Of course, you can also use other computing tools, such as the mac system's own calculator to support the conversion between hexadecimals
Analyzing stack snapshots using jstack
1. Quick find (recommended)
Enter the following command on the command line. This method is faster and is recommended
jstack 12771 | grep -A 20 '769d'
The grep command is the content with the search result of 769d, and - A 20 means to print the last 20 lines of the matching line. Directly help us locate the stack of the thread, and the results are as follows
"yexindong" #8 prio=5 os_prio=0 tid=0x00007effd0182000 nid=0x769d runnable [0x00007effbea0f000]
   java.lang.Thread.State: RUNNABLE
        at java.io.FileOutputStream.writeBytes(Native Method)
        at java.io.FileOutputStream.write(FileOutputStream.java:326)
        at java.io.BufferedOutputStream.flushBuffer(BufferedOutputStream.java:82)
        at java.io.BufferedOutputStream.flush(BufferedOutputStream.java:140)
        - locked <0x00000000ecd6ea10> (a java.io.BufferedOutputStream)
        at java.io.PrintStream.write(PrintStream.java:482)
        - locked <0x00000000ecd65a10> (a java.io.PrintStream)
        at sun.nio.cs.StreamEncoder.writeBytes(StreamEncoder.java:221)
        at sun.nio.cs.StreamEncoder.implFlushBuffer(StreamEncoder.java:291)
        at sun.nio.cs.StreamEncoder.flushBuffer(StreamEncoder.java:104)
        - locked <0x00000000ecd659c8> (a java.io.OutputStreamWriter)
        at java.io.OutputStreamWriter.flushBuffer(OutputStreamWriter.java:185)
        at java.io.PrintStream.newLine(PrintStream.java:546)
        - locked <0x00000000ecd65a10> (a java.io.PrintStream)
        at java.io.PrintStream.println(PrintStream.java:737)
        - locked <0x00000000ecd65a10> (a java.io.PrintStream)
        at com.test.Test$1.run(Test.java:13)
        at java.lang.Thread.run(Thread.java:748)
2. Conventional method
Of course, you can also use the following method to print out all stack snapshots first;
jstack 30328
The printing results are as follows
[root@VM_0_5_centos ~]# jstack 30328
2021-07-14 23:40:34
Full thread dump OpenJDK 64-Bit Server VM (25.232-b09 mixed mode):

"Attach Listener" #10 daemon prio=9 os_prio=0 tid=0x00007effa4001000 nid=0x12f9 waiting on condition [0x0000000000000000]
   java.lang.Thread.State: RUNNABLE

"DestroyJavaVM" #9 prio=5 os_prio=0 tid=0x00007effd004b800 nid=0x7679 waiting on condition [0x0000000000000000]
   java.lang.Thread.State: RUNNABLE

"yexindong" #8 prio=5 os_prio=0 tid=0x00007effd0182000 nid=0x769d runnable [0x00007effbea0f000]
   java.lang.Thread.State: RUNNABLE
        at java.io.FileOutputStream.writeBytes(Native Method)
        at java.io.FileOutputStream.write(FileOutputStream.java:326)
        at java.io.BufferedOutputStream.flushBuffer(BufferedOutputStream.java:82)
        at java.io.BufferedOutputStream.flush(BufferedOutputStream.java:140)
        - locked <0x00000000ecd6ea10> (a java.io.BufferedOutputStream)
        at java.io.PrintStream.write(PrintStream.java:482)
        - locked <0x00000000ecd65a10> (a java.io.PrintStream)
        at sun.nio.cs.StreamEncoder.writeBytes(StreamEncoder.java:221)
        at sun.nio.cs.StreamEncoder.implFlushBuffer(StreamEncoder.java:291)
        at sun.nio.cs.StreamEncoder.flushBuffer(StreamEncoder.java:104)
        - locked <0x00000000ecd659c8> (a java.io.OutputStreamWriter)
        at java.io.OutputStreamWriter.flushBuffer(OutputStreamWriter.java:185)
        at java.io.PrintStream.newLine(PrintStream.java:546)
        - locked <0x00000000ecd65a10> (a java.io.PrintStream)
        at java.io.PrintStream.println(PrintStream.java:737)
        - locked <0x00000000ecd65a10> (a java.io.PrintStream)
        at com.test.Test$1.run(Test.java:13)
        at java.lang.Thread.run(Thread.java:748)

"Service Thread" #7 daemon prio=9 os_prio=0 tid=0x00007effd013e800 nid=0x769b runnable [0x0000000000000000]
   java.lang.Thread.State: RUNNABLE

"C1 CompilerThread1" #6 daemon prio=9 os_prio=0 tid=0x00007effd013b800 nid=0x769a waiting on condition [0x0000000000000000]
   java.lang.Thread.State: RUNNABLE

"C2 CompilerThread0" #5 daemon prio=9 os_prio=0 tid=0x00007effd012d000 nid=0x768b waiting on condition [0x0000000000000000]
   java.lang.Thread.State: RUNNABLE

"Signal Dispatcher" #4 daemon prio=9 os_prio=0 tid=0x00007effd012a800 nid=0x7689 runnable [0x0000000000000000]
   java.lang.Thread.State: RUNNABLE

"Finalizer" #3 daemon prio=8 os_prio=0 tid=0x00007effd0101000 nid=0x7683 in Object.wait() [0x00007effbf906000]
   java.lang.Thread.State: WAITING (on object monitor)
        at java.lang.Object.wait(Native Method)
        - waiting on <0x00000000ecd66260> (a java.lang.ref.ReferenceQueue$Lock)
        at java.lang.ref.ReferenceQueue.remove(ReferenceQueue.java:144)
        - locked <0x00000000ecd66260> (a java.lang.ref.ReferenceQueue$Lock)
        at java.lang.ref.ReferenceQueue.remove(ReferenceQueue.java:165)
        at java.lang.ref.Finalizer$FinalizerThread.run(Finalizer.java:216)

"Reference Handler" #2 daemon prio=10 os_prio=0 tid=0x00007effd00fc000 nid=0x767f in Object.wait() [0x00007effbfa07000]
   java.lang.Thread.State: WAITING (on object monitor)
        at java.lang.Object.wait(Native Method)
        - waiting on <0x00000000ecd66418> (a java.lang.ref.Reference$Lock)
        at java.lang.Object.wait(Object.java:502)
        at java.lang.ref.Reference.tryHandlePending(Reference.java:191)
        - locked <0x00000000ecd66418> (a java.lang.ref.Reference$Lock)
        at java.lang.ref.Reference$ReferenceHandler.run(Reference.java:153)

"VM Thread" os_prio=0 tid=0x00007effd00f2800 nid=0x767d runnable

"VM Periodic Task Thread" os_prio=0 tid=0x00007effd0141000 nid=0x769c waiting on condition

JNI global references: 5
Then I copied the hexadecimal value just calculated and searched it here. After checking, we know that the thread named yexindong has just made an error. The error is located in the 13th line of Test.java
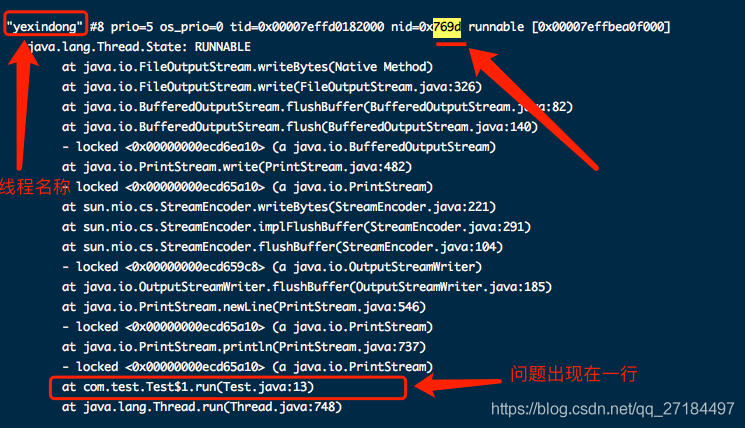
Let's look at the java code. It is really caused by the dead loop here on line 13
Actual combat II. Find out the thread with the highest cpu consumption (windows system)
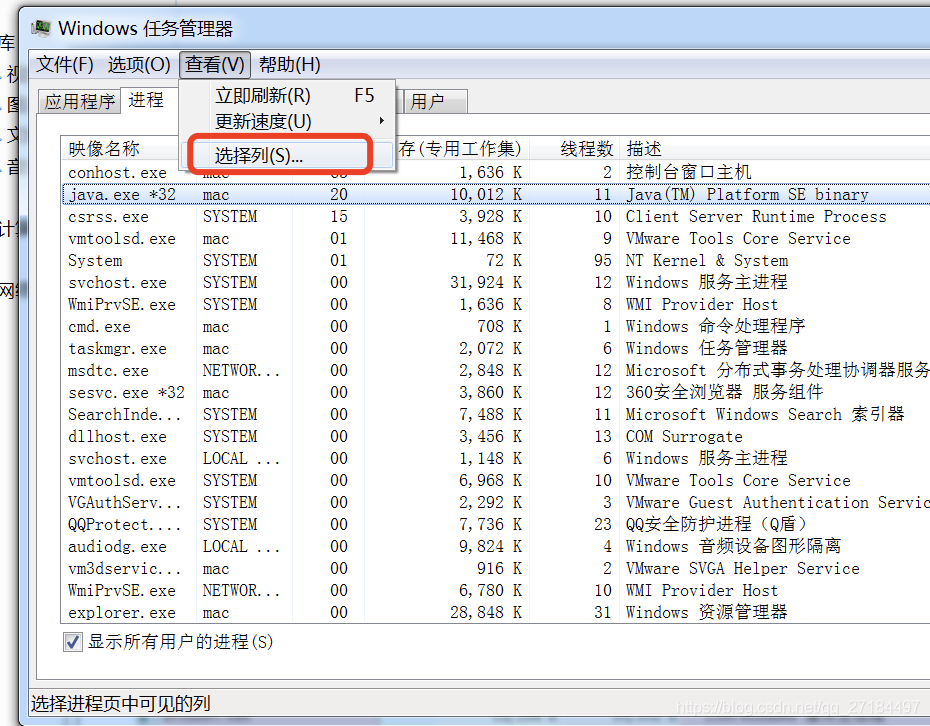
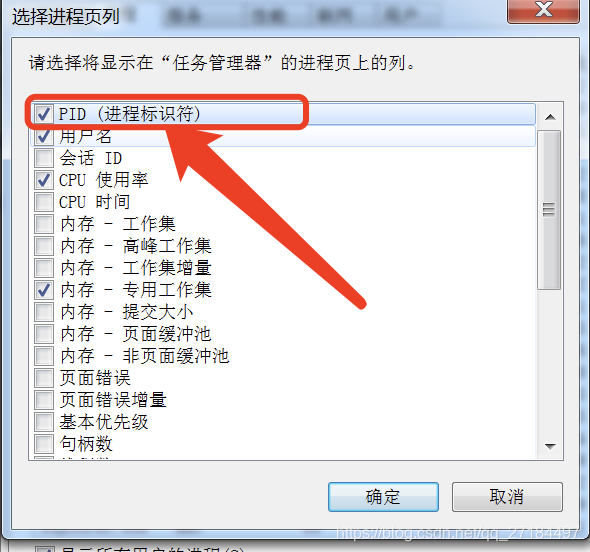
First open the task manager, because the default windows task manager does not display the process pid, so we need to set it, select View → select column
Select the PID process indicator and click OK
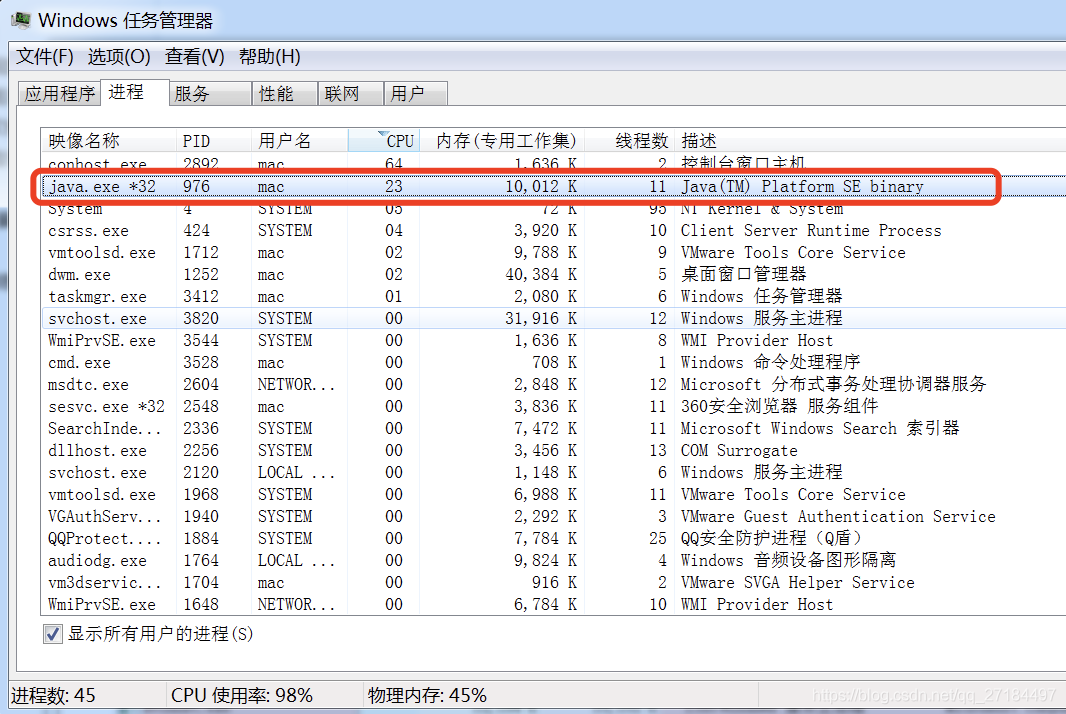
Check the process number pid
Then we can see that the PID of the java process with the highest CPU consumption is 976
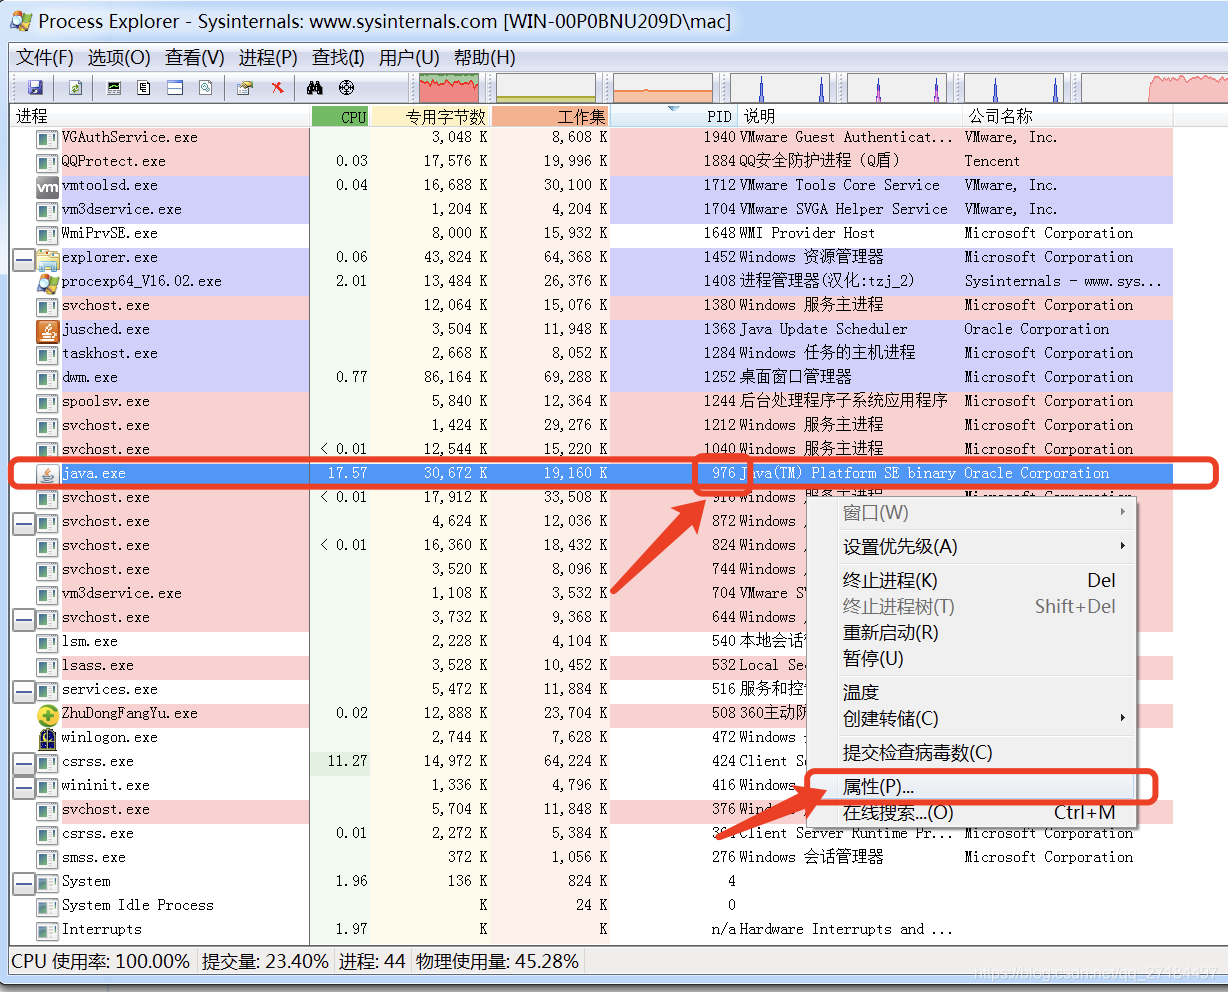
Check thread number TID
Because windows cannot directly view the thread information in the java process, we need to use a tool developed by Microsoft, called Process Explorer. There are many children's shoes on the Internet. Please Baidu yourself. Open the process with pid 976 and right-click to select → attribute
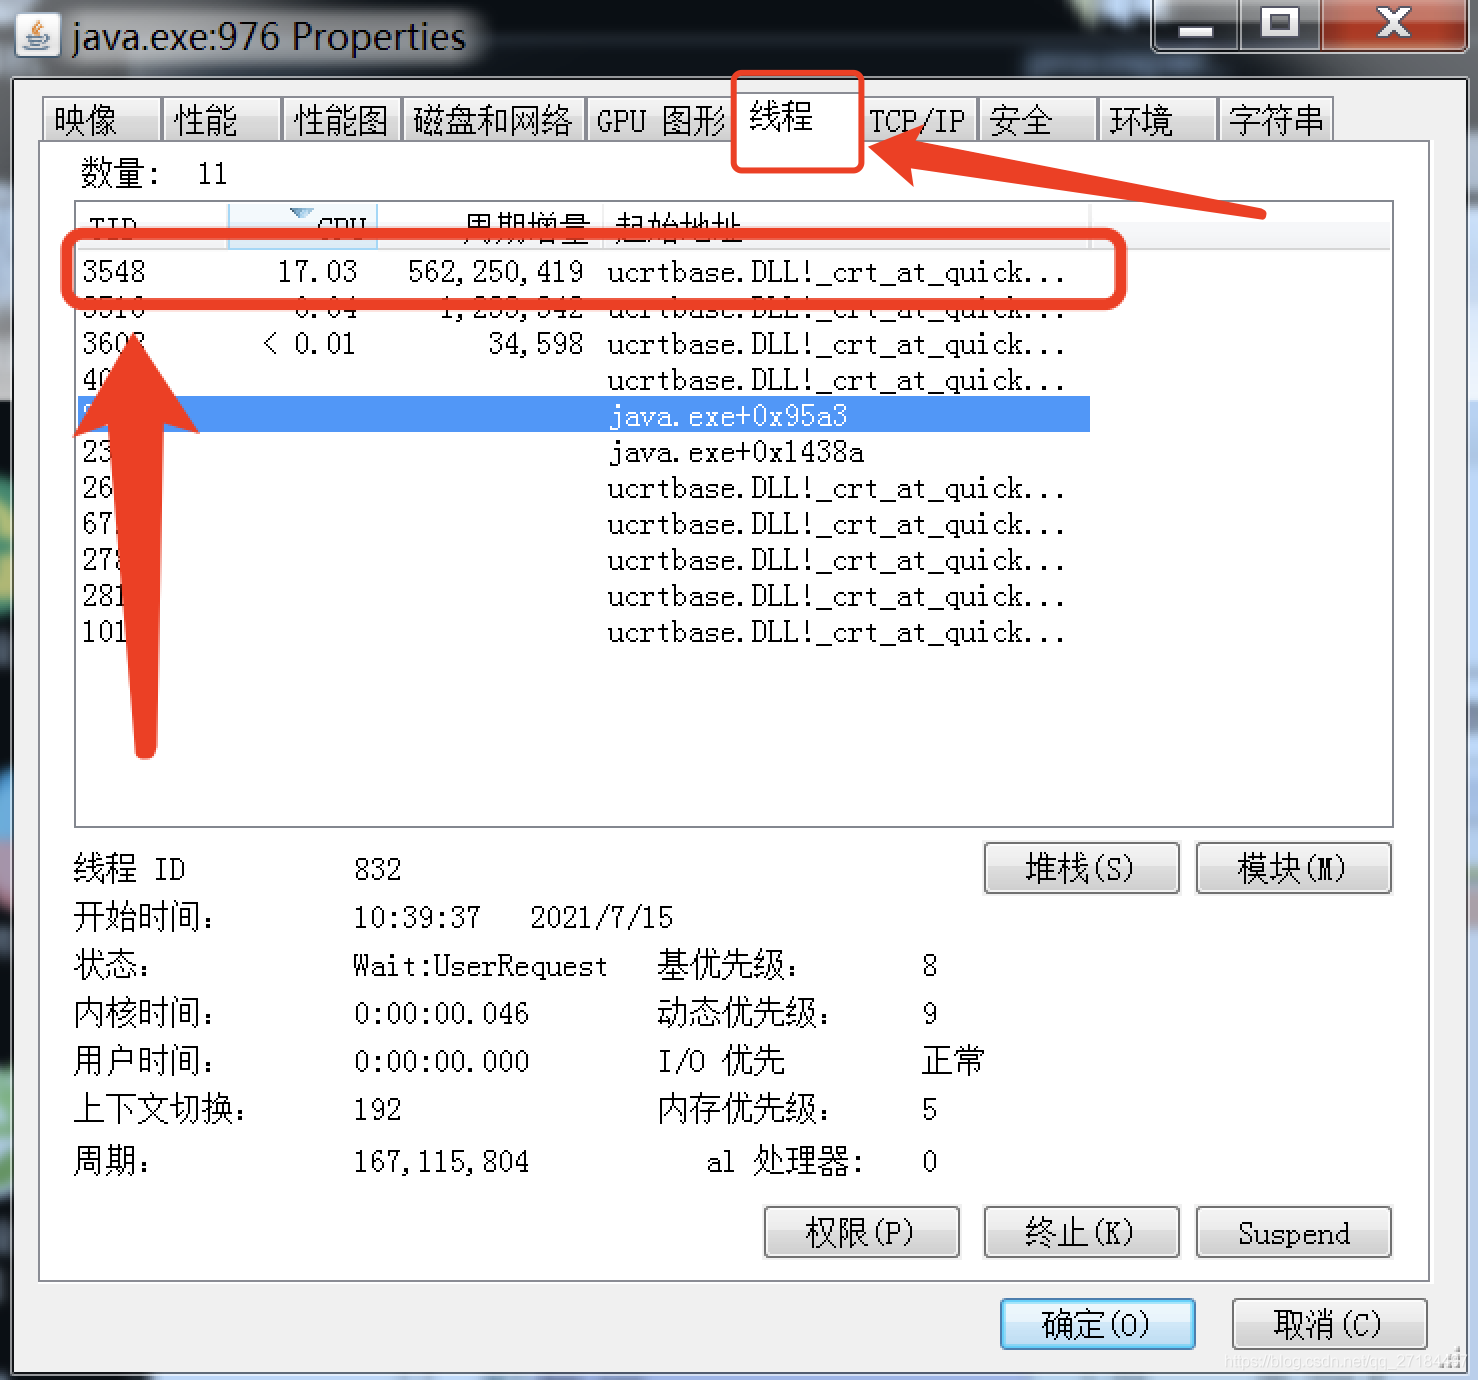
Find the thread column in the pop-up window. By default, it is sorted in reverse order according to the cpu utilization rate, so the top is the thread that occupies the highest cpu. Remember its thread id: 3548
Thread id to hexadecimal
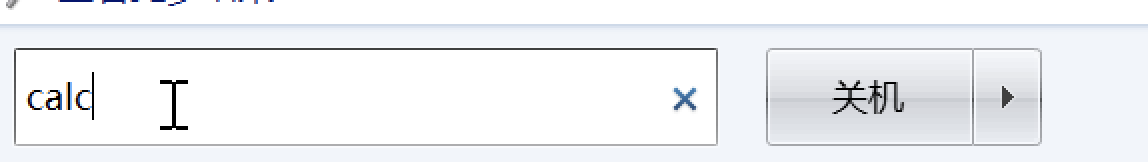
The process id we just got is decimal, but in the jstag information we exported, the thread id is displayed in hexadecimal, so we need to convert the thread id from 3548 to hexadecimal, use the calculator provided by windows, and enter calc on the shortcut command line
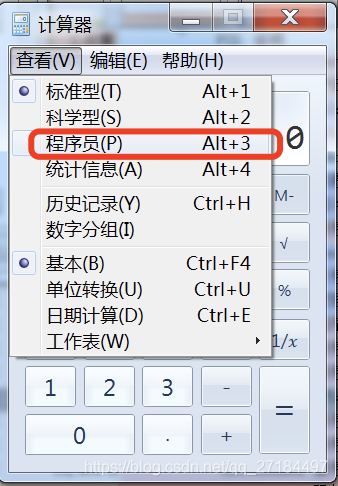
When the calculator is opened, it is set as the calculator used by programmers
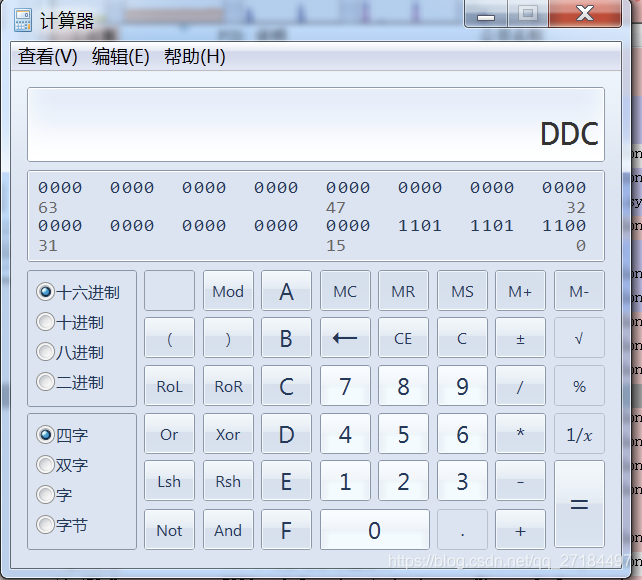
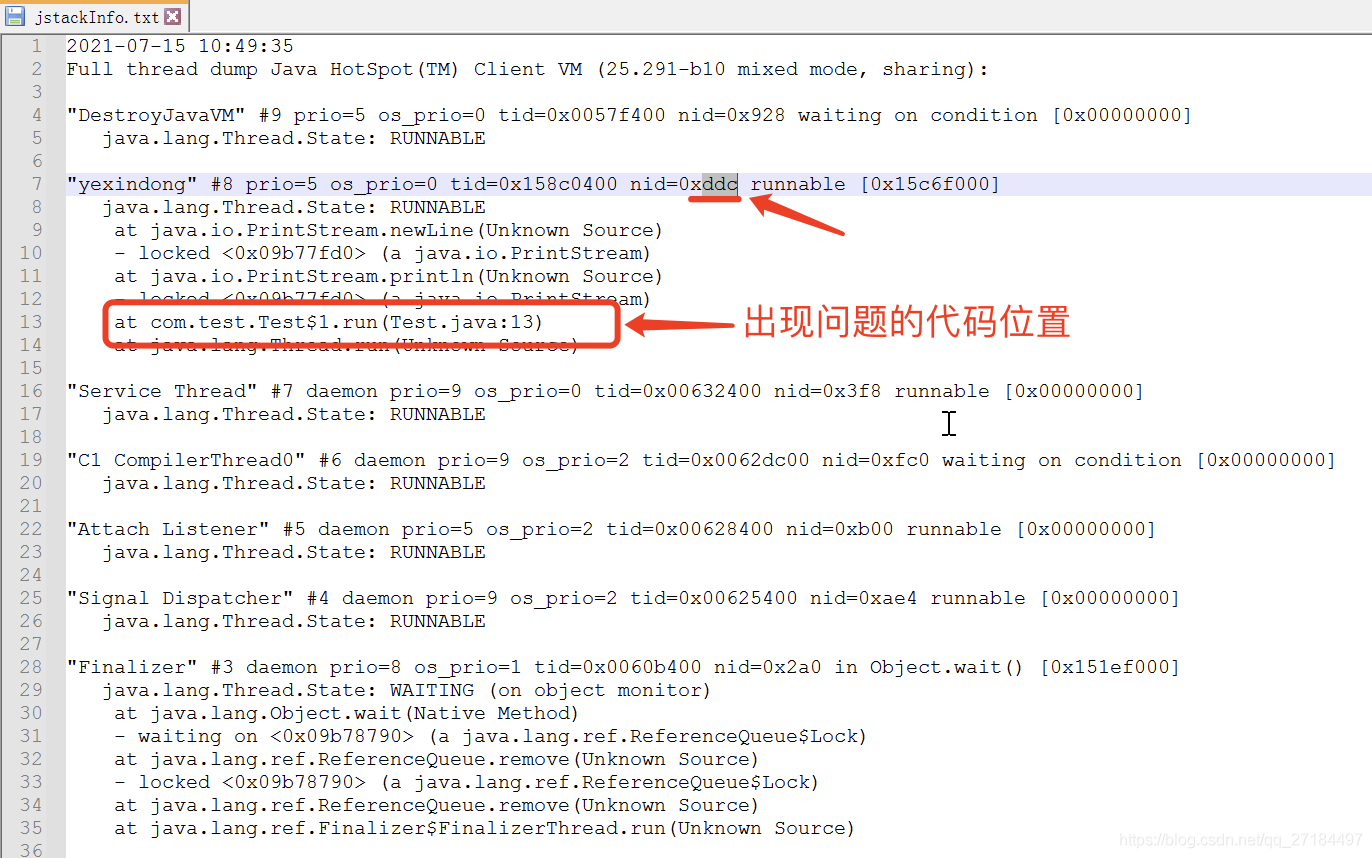
Then input the thread ID 3548 and click hexadecimal to automatically convert the result to ddc. Remember this hexadecimal;
Use jstack to export the stack and analyze it
Enter the following command on the command line to export the stack snapshot information of the process
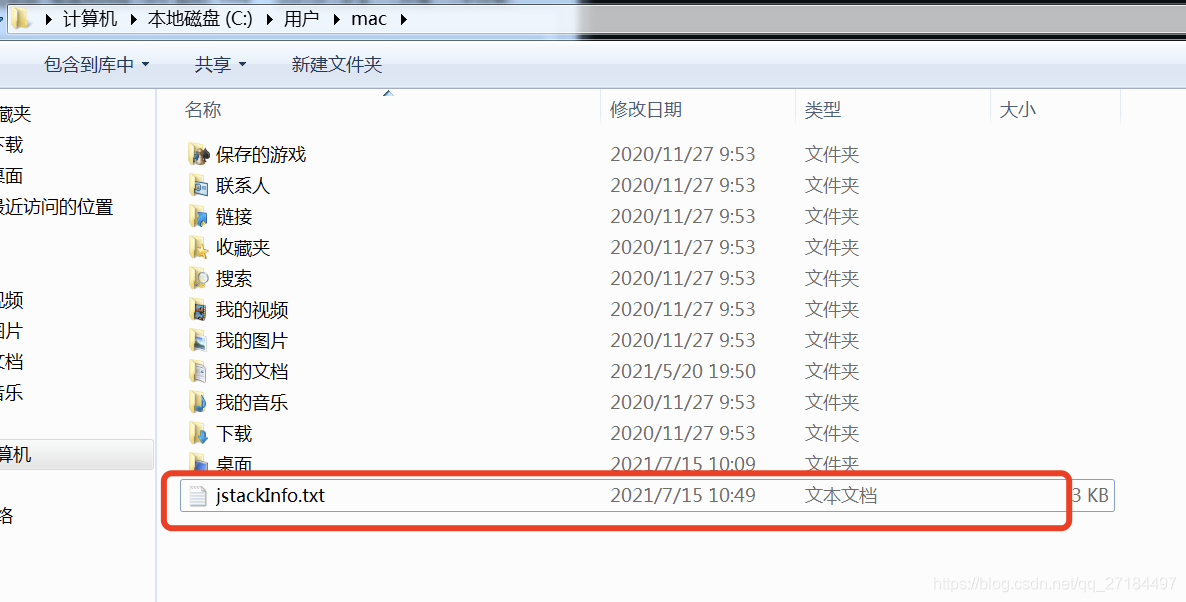
jstack 976 > jstackInfo.txt
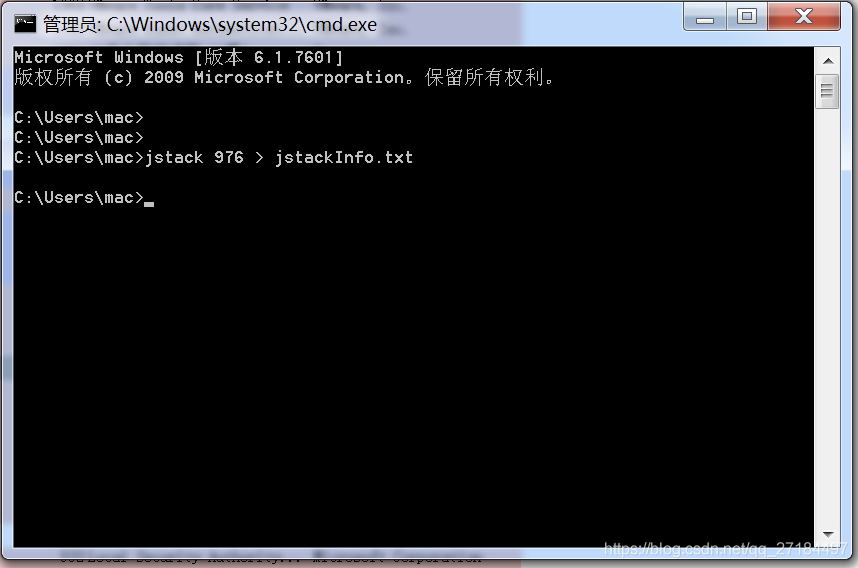
A few seconds later, the snapshot was exported, lying quietly in the folder, waiting for us to open it
Open the exported file with Notepad + +, search the hexadecimal ddc just calculated, and you can locate the error location of the thread
Print stack at java level
Some children's shoes may find it troublesome to use this jstack command. Can java print the stack in the code? Don't say, it's true. It's this method: Thread.getAllStackTraces(); Just say not practice the fake skill. Let's have a demo to test it
    public static void main(String[] args) throws InterruptedException {
		// First thread, dead loop
        new Thread(new Runnable() {
            @Override
            public void run() {
                while (true){

                }
            }
        },"while").start();
		// One second delay
        Thread.sleep(1000);
        // The second thread is used to print the stack
        new Thread(new Runnable() {
            @Override
            public void run() {
                Map<Thread, StackTraceElement[]> allStackTraces = Thread.getAllStackTraces();
                for (Map.Entry<Thread, StackTraceElement[]> threadEntry : allStackTraces.entrySet()) {
                    Thread key = threadEntry.getKey();
                    System.out.println(key);
                    StackTraceElement[] value = threadEntry.getValue();
                    for (StackTraceElement stackTraceElement : value) {
                        System.out.println("      "+stackTraceElement.toString());
                    }
                }
            }
        },"stack-info").start();
    }
The print results after execution are as follows. It can be seen that all threads of the current process are printed, but only simple stack information is printed here, which has played a monitoring role for developers;
Thread[Reference Handler,10,system]
      java.lang.Object.wait(Native Method)
      java.lang.Object.wait(Object.java:502)
      java.lang.ref.Reference.tryHandlePending(Reference.java:191)
      java.lang.ref.Reference$ReferenceHandler.run(Reference.java:153)
Thread[while,5,main]
      com.test.Test$1.run(Test.java:29)
      java.lang.Thread.run(Thread.java:748)
Thread[Monitor Ctrl-Break,5,main]
      java.net.SocketInputStream.socketRead0(Native Method)
      java.net.SocketInputStream.socketRead(SocketInputStream.java:116)
      java.net.SocketInputStream.read(SocketInputStream.java:171)
      java.net.SocketInputStream.read(SocketInputStream.java:141)
      sun.nio.cs.StreamDecoder.readBytes(StreamDecoder.java:284)
      sun.nio.cs.StreamDecoder.implRead(StreamDecoder.java:326)
      sun.nio.cs.StreamDecoder.read(StreamDecoder.java:178)
      java.io.InputStreamReader.read(InputStreamReader.java:184)
      java.io.BufferedReader.fill(BufferedReader.java:161)
      java.io.BufferedReader.readLine(BufferedReader.java:324)
      java.io.BufferedReader.readLine(BufferedReader.java:389)
      com.intellij.rt.execution.application.AppMainV2$1.run(AppMainV2.java:61)
Thread[Finalizer,8,system]
      java.lang.Object.wait(Native Method)
      java.lang.ref.ReferenceQueue.remove(ReferenceQueue.java:144)
      java.lang.ref.ReferenceQueue.remove(ReferenceQueue.java:165)
      java.lang.ref.Finalizer$FinalizerThread.run(Finalizer.java:216)
Thread[stack-info,5,main]
      java.lang.Thread.dumpThreads(Native Method)
      java.lang.Thread.getAllStackTraces(Thread.java:1610)
      com.test.Test$2.run(Test.java:39)
      java.lang.Thread.run(Thread.java:748)
Thread[Attach Listener,9,system]
Thread[Signal Dispatcher,9,system]
finish
As a tool for tuning and error finding, jstack is the most used tool, but it has been replaced slowly due to its limitations; We prefer to use arthas, a tool developed by Alibaba; Interested children's shoes can understand!