Introduction to this article:
- Production failure scenario introduction
- TCP connection establishment three times handshake process
- TCP disconnection four wave process
- Analyze the source code with Java stack
- Then find the "culprit" from the stack
- Problem optimization scheme summary
1. Production failure scenario introduction
Business profile:
This service mainly provides external proxy interfaces. Most interfaces will call third-party interfaces. After data acquisition, aggregation processing will be done and provided to the client for use.
One night, the system was at its peak, and the little partner of the project team was eating "overtime meal" with relish 🍚 Put it in your mouth and send an alarm with e-mail and text messages at the same time.
When a server interface times out, it will occasionally receive similar alarms, sometimes due to network fluctuations and other reasons. I'm really sorry. I always let other "Internet" students carry the pot:). However, the alarm did not converge. The alarm lasted more than ten minutes and felt bad.
Click the URL interface link of the alarm in the e-mail and keep turning around the page. The response is very slow. It's a tragedy!
Now, silently 🍱 Pushing the lunch box aside, I couldn't bear to look straight at it 😦
Basic process of problem location:
1) Determine the scope of influence
There are several servers hanging behind the service, and only one server has hung up, so it will not have a great impact on users.
Temporarily remove it from the registration center first. Don't let the client continue to retry to this machine. Keep the scene of the accident.
2) Troubleshooting and monitoring indicators
Check the traffic volume of the interface service. Because it is the evening peak, the traffic volume of users will be greater than that in other time periods. However, the traffic volume does not increase significantly compared with the usual same time period.
Observe the CPU, memory, IO and network indicators of the server on the monitor, and everything seems normal.
3) Server troubleshooting
Log in to the server and further check the CPU, memory and other indicators of the server in combination with monitoring. It is normal to check the service log, and no special Exception log output, Exception or OOM and other exceptions are found.
What we see is that the interface service can no longer respond normally. The application runs on the JVM and quickly checks through the common commands provided by the JDK.
Print stack information with the following command:
jstack -l $pid > jstack.log
The statistical results are as follows:
cat jstack.log | grep "java.lang.Thread.State" | sort -nr | uniq -c
994    java.lang.Thread.State: WAITING (parking)
501    java.lang.Thread.State: WAITING (on object monitor)
7      java.lang.Thread.State: TIMED_WAITING (sleeping)
13     java.lang.Thread.State: TIMED_WAITING (parking)
2      java.lang.Thread.State: TIMED_WAITING (on object monitor)
23     java.lang.Thread.State: RUNNABLE
If you encounter thread states such as java.lang.Thread.State: WAITING (parking) and java.lang.Thread.State: WAITING (on object monitor), you should pay attention. Generally, it may be caused by problems in the program itself.
According to java.lang.Thread.State: WAITING, check the stack information in jsstack.log, and find a large number of logs calling HttpClient tool class to request pending. The specific stack information will be analyzed in detail below.
These service calls are directly called through the HttpClient tool, encapsulating the Spring RestTemplate, and the underlying layer is also the Apache HttpClient tool class called to realize service calls.
In addition to the above jstack log exceptions, we also checked the network status on the server, which is also a common troubleshooting method for operation and maintenance students.
Attach the command to count the network connection status:
netstat -n | awk '/^tcp/ {++State[$NF]} END {for(i in State) print i, State[i]}'
Statistical results:
TIME_WAIT 9
CLOSE_WAIT 3826
SYN_SENT 2
ESTABLISHED 28
SYN_RECV 8
Note here that we see a large number of close in the server's strange network connection statistics_ Wait status connection.
Moreover, this state will still exist when you execute the statistics command again at an interval, that is, it will not be released. It seems that the problem is a little serious.
Further speculation, there are these close_ The wait state should be related to the slow response of the interface, as well as the HttpClient thread blocking in the java stack information. It should be analyzed as a breakthrough.
Let's learn about close first_ Wait status, this close_ The wait state is in the process of TCP network disconnection. When the client initiates a disconnection request, the server receives the disconnection request for the first time, replies to the confirmation message, and then it is in close_ The wait status is. When the server response is processed, it will reply the network packet to the client, and the normal connection will be closed.
2. TCP connection establishment three times handshake process
Although close_ The wait state is in the process of waving four times during the TCP network connection. It is still necessary for us to understand the three handshakes of TCP network connection first, because it is the first thing that the requesting server needs to do, that is to establish a TCP connection.
Technology comes from life.
We can take an example in daily life to understand the process of TCP three handshakes.
For example, you want to chat with a friend you haven't met for a long time on wechat:
Xiao Dong: Xiao Sheng, are you there?
(after a long time...)
Xiao Sheng: Yes, are you still there?
(Xiao Dong is just online and brushes the circle of friends every day...)
Xiao Dong: Yes, I am
(then the two start talking...)
If you usually chat with your friends like this at the beginning, do you feel very tired.
In fact, the above process can well understand the process of TCP three handshakes.
Let's see Xiaodong as a "client" and Xiaosheng as a "server".
Xiaodong is a programmer and does IT work. Xiao Sheng is starting a business in his hometown.
Understand the TCP triple handshake process:
1) Xiaodong, as a "client", initiates a chat with Xiaosheng as a "server", that is, he sends a network packet (the packet signature is syn ) Here's Xiao Sheng TCP shakes hands for the first time, and Xiaodong is in a state at this time syn_sent [status]
2) Xiaosheng received Xiaodong's chat network package. You have to confirm that you have received IT. At this time, Xiaosheng has other things. He doesn't do IT work like Xiaodong. He is still on wechat at work. In the evening, Xiaosheng had time to take a look at the mobile wechat and pop up Xiaodong's message. Then, excitedly made a reply "for Xiaodong sync Bag, made a ack Reply "confirm". Because after a period of time, Xiao Sheng is not sure that Xiao Dong is still offline. [this is TCP shakes hands for the second time, and the small rise state is at this time syn_rcvd [status]
3) Because Xiaodong was just online, he received Xiaosheng's reply confirmation message and immediately made a reply to this message "to Xiaosheng sync + ack, further ack Reply to confirm that this is TCP third handshake. [Xiaosheng state becomes established [chat status immediately]
4) At this time, Xiao Sheng was also online, and the two began to talk hot. [the data has been officially transmitted, and Xiaodong and Xiaosheng are in a state of established [status]
Those states mentioned above syn_sent syn_rcvd established , It is the key state involved in the process of TCP three handshakes.
Let's intuitively understand from the previous figure:

3. TCP disconnection four wave process
The hot chat between Xiaodong and Xiaosheng is over. It's late and busy all day. We need to rest.
Xiao Dong will get up early tomorrow for work reasons, so he told Xiao Sheng in advance:
Xiao Dong: I'll get up at 4 a.m. tomorrow to upgrade the system. I'll have an early rest and come over to buy you a drink another day!
Xiao Sheng: yes??? Well, I don't understand anyway!
Xiao Sheng: let's have an early rest. The wine you said is still to be drunk!
Xiao Dong: Well, good night! You should also sleep early.
Xiao Sheng: OK, good night, brother!
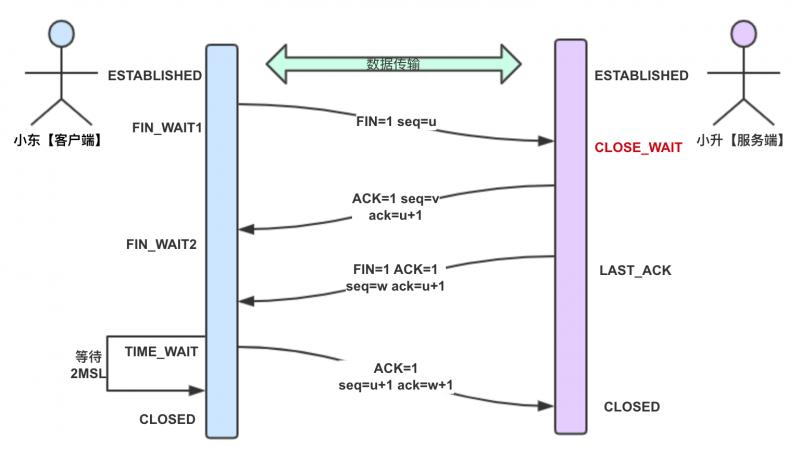
Corresponding understanding of TCP's four waving processes:
1) Xiao Dong is going to have a rest. He launched a campaign fin1 Bao is going to end the chat. [Xiaodong status is in fin_wait1 Status, this is [first wave]
2) Xiao Sheng received Xiao Dong's letter fin1 Bag, reply ack Confirmation message. [at this time, the small rise state is in close_wait Status, Xiaodong's status is fin_wait2, this is [Second Wave]
3) Xiao Sheng came for a final confirmation. He didn't intend to continue talking. He sent it fin2 Bag. [at this time, the small rise state is in last_ack Status, this is [Third Wave]
4) Xiaodong sent it to Xiaosheng fin2 Package, finally replied ack Confirm. [at this time, Xiaodong is in a state of time_wait Status, this is [Fourth Wave]
Why is Xiaodong still in time_wait Wait a minute?
Because according to the "old rules", they had to make sure that Xiaosheng did receive the last message before they could finally end the chat.
time_wait Status criteria duration is** 4 * * minutes. During this period, the TCP network connection socket resources (ports) established by Xiaodong and Xiaosheng cannot be used by others or recycled by the system.
If Xiaosheng doesn't receive feedback, he will continue to ask "resend fin2 message" until Xiaodong sends ack message successfully.
Both parties officially close the chat channel, release port resources and close the connection.
The 4 minutes waiting is 2 MSLS, and each MSL is 2 minutes. MSL is maximum segment lifetime - the longest message lifetime. This time is stipulated by the official RFC agreement.
From the previous figure, we can further intuitively understand:
4. Analyze the source code with Java stack
After analyzing the four wave process of TCP, when the server receives the TCP disconnect request packet, it needs to reply a confirmation message to the client. At this time, the server state is closed_ Wait status.
We know the location of the network connection where the state is located. Combined with the problems mentioned above, a large number of threads are blocked on HttpClient calls. The thread status is WAITING. According to the statistics on the server, a large number of threads are closed_ The network connection in wait state cannot be released.
Threads are valuable resources in the JVM process. If a large number of threads are waiting or blocking all the time, all threads will be occupied slowly, resulting in the service unable to respond normally.
Let's analyze the specific reasons through the java thread stack information and the source code.
Find the first critical stack log:
"http-nio-8970-exec-1108" #24971 daemon prio=5 os_prio=0 tid=0x00007f45b4445800 nid=0x61ad waiting on condition [0x00007f444ad69000]
java.lang.Thread.State: WAITING (parking)
		at sun.misc.Unsafe.park(Native Method)
		- parking to wait for  <0x00000006c2f30968> (a java.util.concurrent.locks.AbstractQueuedSynchronizer$ConditionObject)
		at java.util.concurrent.locks.LockSupport.park(LockSupport.java:175)
		at java.util.concurrent.locks.AbstractQueuedSynchronizer$ConditionObject.await(AbstractQueuedSynchronizer.java:2039)
		at org.apache.http.pool.AbstractConnPool.getPoolEntryBlocking(AbstractConnPool.java:380)
		at org.apache.http.pool.AbstractConnPool.access$200(AbstractConnPool.java:69)
		at org.apache.http.pool.AbstractConnPool$2.get(AbstractConnPool.java:246)
		- locked <0x0000000641c7fe38> (a org.apache.http.pool.AbstractConnPool$2)
		at org.apache.http.pool.AbstractConnPool$2.get(AbstractConnPool.java:193)
		at org.apache.http.impl.conn.PoolingHttpClientConnectionManager.leaseConnection(PoolingHttpClientConnectionManager.java:303)
		at org.apache.http.impl.conn.PoolingHttpClientConnectionManager$1.get(PoolingHttpClientConnectionManager.java:279)
		at org.apache.http.impl.execchain.MainClientExec.execute(MainClientExec.java:191)
		at org.apache.http.impl.execchain.ProtocolExec.execute(ProtocolExec.java:185)
		at org.apache.http.impl.execchain.RetryExec.execute(RetryExec.java:89)
		at org.apache.http.impl.execchain.RedirectExec.execute(RedirectExec.java:111)
		at org.apache.http.impl.client.InternalHttpClient.doExecute(InternalHttpClient.java:185)
		at org.apache.http.impl.client.CloseableHttpClient.execute(CloseableHttpClient.java:83)
		at org.apache.http.impl.client.CloseableHttpClient.execute(CloseableHttpClient.java:56)
		at org.springframework.http.client.HttpComponentsClientHttpRequest.executeInternal(HttpComponentsClientHttpRequest.java:89)
		at org.springframework.http.client.AbstractBufferingClientHttpRequest.executeInternal(AbstractBufferingClientHttpRequest.java:48)
		at org.springframework.http.client.AbstractClientHttpRequest.execute(AbstractClientHttpRequest.java:53)
		at org.springframework.web.client.RestTemplate.doExecute(RestTemplate.java:660)
		at org.springframework.web.client.RestTemplate.execute(RestTemplate.java:629)
		at org.springframework.web.client.RestTemplate.getForEntity(RestTemplate.java:329)
		at com.xxx.proxy.common.util.HttpClientUtil.getForEntity(HttpClientUtil.java:267)
		at com.xxx.proxy.common.util.HttpClientUtil.getForObject(HttpClientUtil.java:521)
... ...
There are a large number of the above logs in the stack log, which are basically called by the HttpClient tool class, and all threads are in state java.lang.Thread.State: WAITING (parking) Status.
appear The WAITING (parking) thread is in a suspended state because a large number of third-party interfaces are called inside the interface service. To obtain an Http connection, it is always unable to obtain it and can only wait.
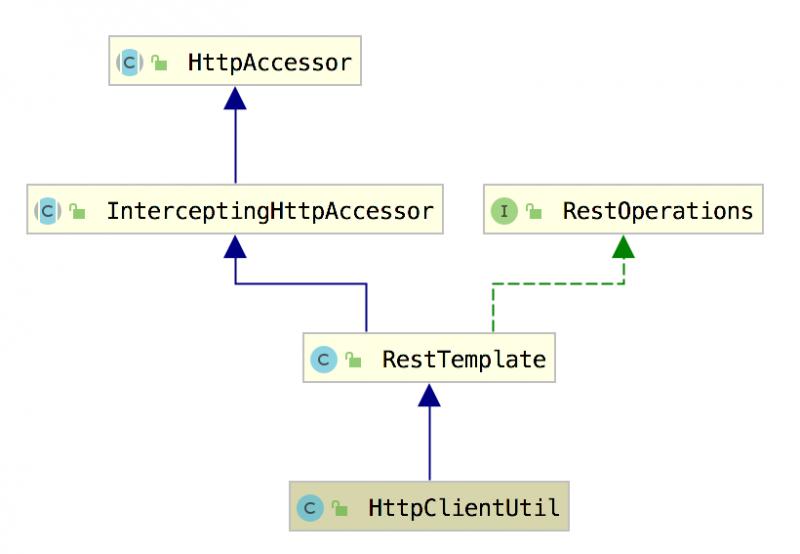
HttpClientUtil tool class inherits from Spring RestTemplate and makes some parameters, retry mechanism and proxy customization. Its package path is located in org.springframework.web.client.RestTemplate .
The class diagram is as follows:
Create HttpClient tool example code:
HttpClientFactoryBean httpClientFactoryBean = new HttpClientFactoryBean(config);
					HttpComponentsClientHttpRequestFactory httpRequestFactory = new HttpComponentsClientHttpRequestFactory(httpClientFactoryBean.getObject());
					return new HttpClientUtil(httpRequestFactory);
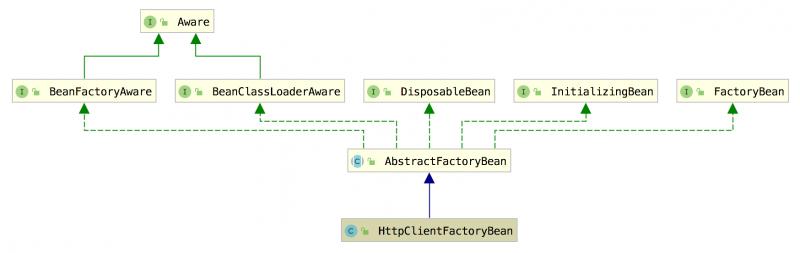
HttpClientFactoryBean inherits from AbstractFactoryBean and overrides getObjectType() and createInstance() methods.
The class diagram is as follows:
Some sample methods of HttpClientFactoryBean:
@Override
public Class<?> getObjectType() {
		return HttpClient.class;
}

@Override
protected HttpClient createInstance() {
	if (restConfig == null) {
			HttpClients.custom().build();
	}
	// Maximum connections per route
	int maxPerRoute = restConfig.getMaxConnections();
	// Total maximum connections
	int maxTotal = restConfig.getMaxTotalConnections();
	// Connection timeout
	int connectTimeout = restConfig.getConnectionTimeout();
  // Timeout for reading data
	int socketTimeout = restConfig.getTimeout();

	PoolingHttpClientConnectionManager connManager = new PoolingHttpClientConnectionManager(30, TimeUnit.SECONDS);
	connManager.setDefaultMaxPerRoute(maxPerRoute);
	connManager.setMaxTotal(maxTotal);
	connManager.setValidateAfterInactivity(1000);

	RequestConfig requestConfig = RequestConfig.custom().setConnectTimeout(connectTimeout)		.setSocketTimeout(socketTimeout).build();

/ ... Omit some codes
return HttpClients.custom().setConnectionManager(connManager).evictExpiredConnections().setDefaultRequestConfig(requestConfig).build();
}
According to the stack information, you can also see that PoolingHttpClientConnectionManager The leaseConnection() method of gets the connection. We can take a detailed look at the source code. Why didn't we get the connection successfully?
How to find the source code? Through the call stack link in the stack information, you can easily find which classes, methods and lines of code have passed.
According to the log in jstack above:
org.apache.http.pool.AbstractConnPool.getPoolEntryBlocking(AbstractConnPool.java:380)
Guess according to the name, abstract the class of the connection pool through AbstractConnPool, call the getPoolEntryBlocking blocking blocking method to obtain the connection, and the code in line 380.
View source code:
private E getPoolEntryBlocking(
					final T route, final Object state,
					final long timeout, final TimeUnit tunit,
					final Future<E> future) throws IOException, InterruptedException, TimeoutException {

	Date deadline = null;
	// Get connection timeout parameter
	if (timeout > 0) {
			deadline = new Date (System.currentTimeMillis() + tunit.toMillis(timeout));
	}
	this.lock.lock();
	try {
			final RouteSpecificPool<T, C, E> pool = getPool(route);
			// ... omit part of the source code

			boolean success = false;
			try {
					if (future.isCancelled()) {
							throw new InterruptedException("Operation interrupted");
					}
					// Put future, whose actual type is future < cpoolentry >, into the pending two-way linked list queue
					pool.queue(future);
					this.pending.add(future);
					if (deadline != null) {
							success = this.condition.awaitUntil(deadline);
					} else {
						 // Here is line 380 of the source code
							this.condition.await();
							success = true;
					}
					if (future.isCancelled()) {
							throw new InterruptedException("Operation interrupted");
					}
			} finally {
					// In case of 'success', we were woken up by the
					// connection pool and should now have a connection
					// waiting for us, or else we're shutting down.
					// Just continue in the loop, both cases are checked.
					pool.unqueue(future);
					this.pending.remove(future);
			}
			// check for spurious wakeup vs. timeout
			if (!success && (deadline != null && deadline.getTime() <= System.currentTimeMillis()))           {
					break;
			}
		}
		throw new TimeoutException("Timeout waiting for connection");
	} finally {
				this.lock.unlock();
	}
}
Find the source code in line 380 and call the await() method of condition:
this.condition.await();
The Condition under concurrent contract is used to implement the multi-threaded coordinated communication mechanism. After the await() method is called, the current thread will be added to the Condition waiting queue, which is a queue of FIFO structure. At the same time, the current thread lock will be released. If it is not released, other threads will not be able to obtain the lock, which may cause deadlock.
await() method source code:
public final void await() throws InterruptedException {
		if (Thread.interrupted())
				throw new InterruptedException();
		// Join the Condition waiting queue
		Node node = addConditionWaiter();
		// Release the lock of the current thread
		long savedState = fullyRelease(node);
		int interruptMode = 0;
		// If it is not in the AQS synchronization queue, suspend the current thread. If it exits the loop in the AQS queue
		while (!isOnSyncQueue(node)) {
				LockSupport.park(this);
				if ((interruptMode = checkInterruptWhileWaiting(node)) != 0)
						break;
		}
		// Has been awakened by the signal() method, waiting for an attempt to acquire the lock again
		if (acquireQueued(node, savedState) && interruptMode != THROW_IE)
				interruptMode = REINTERRUPT;
		if (node.nextWaiter != null) // clean up if cancelled
				unlinkCancelledWaiters();
		if (interruptMode != 0)
				reportInterruptAfterWait(interruptMode);
}
Structure diagram of the current thread joining the Condition waiting queue:
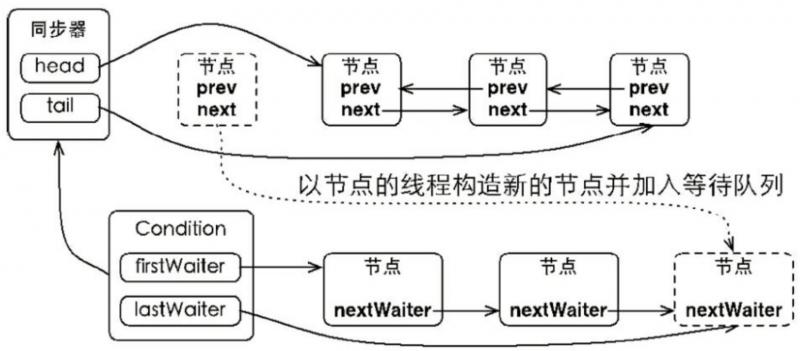
When the signalAll() or signal() method is called through the Condtion, the first node of the waiting queue will be obtained, moved to the synchronization queue, and the thread in the node will be awakened by LockSupport. The node moves from the waiting queue to the AQS synchronization queue, as shown in the following structure diagram:

The code for release() to release the connection was found in the of AbstractConnPool class.
The source code of the release() method is as follows:
@Override
public void release(final E entry, final boolean reusable) {
		this.lock.lock();
	try {
		if (this.leased.remove(entry)) {
				final RouteSpecificPool<T, C, E> pool = getPool(entry.getRoute());
				pool.free(entry, reusable);
				if (reusable && !this.isShutDown) {
						this.available.addFirst(entry);
				} else {
						entry.close();
				}
				onRelease(entry);
				Future<E> future = pool.nextPending();
				if (future != null) {
						this.pending.remove(future);
				} else {
						future = this.pending.poll();
				}
				if (future != null) {
						this.condition.signalAll();
				}
		}
	} finally {
			this.lock.unlock();
	}
}
We see that when the connection is released, the this.condition.signalAll(); The call of the signalall () method will wake up all waiting queue threads. Although all threads are awakened, only one thread can get the lock, and other threads still need to wait.
The source code of signalAll() method is as follows:
private void doSignalAll(Node first) {
	lastWaiter = firstWaiter = null;
	do {
			Node next = first.nextWaiter;
			first.nextWaiter = null;
			// Signal notification
			transferForSignal(first);
			first = next;
	} while (first != null);
}

final boolean transferForSignal(Node node) {
    /*
     * Set waitStatus of node: condition - > 0
     */
    if (!compareAndSetWaitStatus(node, Node.CONDITION, 0))
        return false;

		 // Join the AQS waiting queue, let the node continue to acquire the lock, and set the status of the front node to SIGNAL
    Node p = enq(node);
    int c = p.waitStatus;
    if (c > 0 || !compareAndSetWaitStatus(p, c, Node.SIGNAL))
		    // Call the unpark() method of LockSupport to wake up the thread
        LockSupport.unpark(node.thread);
    return true;
}
After analyzing the underlying code and looking back, we can see that it is because the condition's await() parameterless method is called, and the Http connection has not been obtained, and then it has occupied the pit of the tomcat thread.
At the beginning of getPoolEntryBlocking() method, there is a piece of code that cannot be ignored:
Date deadline = null;
// Get connection timeout parameter
if (timeout > 0) {
	deadline = new Date (System.currentTimeMillis() + tunit.toMillis(timeout));
}
At first glance, this code is the timeout time. Guess, here, the timeout should be the waiting time when obtaining a connection from the connection pool.
The following is the of the getPoolEntryBocking() method:
if (deadline != null) {
		success = this.condition.awaitUntil(deadline);
}
If the deadline is not empty, the awaitUtil(deadline) method of condtion will be called. The awaitUtil(deadline) method indicates that it will wake up automatically and join the AQS synchronization queue to obtain the lock.
We can continue to look for the caller according to the stack information and see the timeout source in deadline.
at org.apache.http.impl.execchain.MainClientExec.execute(MainClientExec.java:191)
Source code of MainClientExec#execute() method:
final HttpClientConnection managedConn;
	try {
		final int timeout = config.getConnectionRequestTimeout();
		managedConn = connRequest.get(timeout > 0 ? timeout : 0, TimeUnit.MILLISECONDS);
	} catch(final InterruptedException interrupted) {
}
The timeout here, that is, connectionRequestTimeout, is the timeout value for calculating the deadline time.
Confirmed our guess.
Initializes the initial configuration parameters of HttpClient tool, but it is not configured connectionRequestTimeout This parameter is also critical. If it is not set and the thread suspended by park has not been awakened by signal, it will wait all the time.
Therefore, this parameter must be set. The deadline here is an absolute time. If it is not empty, the awaitUtil(deadline) method of condition will be called. Even if it is not awakened by signal, it will wake up automatically to compete for locks, instead of causing it to be blocked without being awakened.
Moreover, the awaitUtil(deadline) method is similar to the deadline variable design in awaitNanos(long nanosTimeout) method.
The set timeout has been reached and no signal has been sent. Finally success If the variable is false, it will break out of the loop directly and eventually throw a TimeoutException("Timeout waiting for connection") exception.
When this exception is thrown, it is clear in the system error log that the connection cannot be obtained. At the same time, it also avoids occupying threads all the time.
5. Then find the "culprit" from the stack
In the previous section, we analyzed the underlying source code details of Condition concurrency from the first stack log.
But that's not over, because we count java.lang.Thread.State In, only WAITING (parking) is analyzed Status, and the cause of the problem is not necessarily caused by this status. Next, continue to analyze the status of another "exception" thread WAITING (on object monitor) .
In the java stack The second key log As follows:
"http-nio-8970-exec-462" #24297 daemon prio=5 os_prio=0 tid=0x00007f45b41bd000 nid=0x5f0b in Object.wait() [0x00007f446befa000]
 java.lang.Thread.State: WAITING (on object monitor)
			at java.lang.Object.wait(Native Method)
			at java.lang.Object.wait(Object.java:502)
			at java.net.InetAddress.checkLookupTable(InetAddress.java:1393)
			- locked <0x00000006c05a5570> (a java.util.HashMap)
			at java.net.InetAddress.getAddressesFromNameService(InetAddress.java:1310)
			at java.net.InetAddress.getAllByName0(InetAddress.java:1276)
			at java.net.InetAddress.getAllByName(InetAddress.java:1192)
			at java.net.InetAddress.getAllByName(InetAddress.java:1126)
			at org.apache.http.impl.conn.SystemDefaultDnsResolver.resolve(SystemDefaultDnsResolver.java:45)
			at org.apache.http.impl.conn.DefaultHttpClientConnectionOperator.connect(DefaultHttpClientConnectionOperator.java:112)
			at org.apache.http.impl.conn.PoolingHttpClientConnectionManager.connect(PoolingHttpClientConnectionManager.java:373)
			at org.apache.http.impl.execchain.MainClientExec.establishRoute(MainClientExec.java:381)
			at org.apache.http.impl.execchain.MainClientExec.execute(MainClientExec.java:237)
			at org.apache.http.impl.execchain.ProtocolExec.execute(ProtocolExec.java:185)
			at org.apache.http.impl.execchain.RetryExec.execute(RetryExec.java:89)
			at org.apache.http.impl.execchain.RedirectExec.execute(RedirectExec.java:111)
			at org.apache.http.impl.client.InternalHttpClient.doExecute(InternalHttpClient.java:185)
			at org.apache.http.impl.client.CloseableHttpClient.execute(CloseableHttpClient.java:83)
			at org.apache.http.impl.client.CloseableHttpClient.execute(CloseableHttpClient.java:56)
			at org.springframework.http.client.HttpComponentsClientHttpRequest.executeInternal(HttpComponentsClientHttpRequest.java:89)
			at org.springframework.http.client.AbstractBufferingClientHttpRequest.executeInternal(AbstractBufferingClientHttpRequest.java:48)
			at org.springframework.http.client.AbstractClientHttpRequest.execute(AbstractClientHttpRequest.java:53)
			at org.springframework.web.client.RestTemplate.doExecute(RestTemplate.java:660)
			at org.springframework.web.client.RestTemplate.execute(RestTemplate.java:629)
			at org.springframework.web.client.RestTemplate.getForEntity(RestTemplate.java:329)
			at com.xxx.tvproxy.common.util.HttpClientUtil.getForEntity(HttpClientUtil.java:267)
			at com.xxx.tvproxy.common.util.HttpClientUtil.getForObject(HttpClientUtil.java:521)
``

java.lang.Thread.State: WAITING (on object monitor),Such a thread state should also attract special attention, monitor object locks, and block the thread all the time.

According to the thread stack information, guess is to follow HttpClient For parameter settings, let's analyze the creation parameters.
Find the information at the top of the stack and see that there are calls Object Object wait() Method, indicating that it is waiting for another thread notify Notification, but the current thread is always in WAITING Status.

Continue to find out who called:
at java.net.InetAddress.checkLookupTable(InetAddress.java:1393)
``
This code is caused by a call. Let's look at the source code:
private static InetAddress[] checkLookupTable(String host) {
	synchronized (lookupTable) {
		// If the host isn't in the lookupTable, add it in the
		// lookuptable and return null. The caller should do
		// the lookup.
		if (lookupTable.containsKey(host) == false) {
				lookupTable.put(host, null);
				return null;
		}

		// If the host is in the lookupTable, it means that another
		// thread is trying to look up the addresses of this host.
		// This thread should wait.
		while (lookupTable.containsKey(host)) {
				try {
						// Corresponding to java.net.inetaddress.checklookuptable in the stack (InetAddress. Java: 1393)
						lookupTable.wait();
				} catch (InterruptedException e) {
				}
		}
	}

	// The other thread has finished looking up the addresses of
	// the host. This thread should retry to get the addresses
	// from the addressCache. If it doesn't get the addresses from
	// the cache, it will try to look up the addresses itself.
	InetAddress[] addresses = getCachedAddresses(host);
	if (addresses == null) {
		synchronized (lookupTable) {
				lookupTable.put(host, null);
				return null;
		}
	}

	return addresses;
}
The lookupTable object is found, the synchronized block lock is used, and the wait() method of the lookupTable object is called internally. It is blocked until notification is received.
After troubleshooting the problem code, you can't see any problem, because it has little to do with the application itself. It's the JVM thread deadlock caused by IPV6.
Refer to the wiki of foreign zimbra websites: Configuring for IPv4 - Zimbra :: Tech Center
Here is an explanation of the cause of the problem:
The application itself is in IPv4 environment. If you try to use IPv6, it will cause some known problems.
When the Inet6AddressImpl.lookupAllHostAddr() method is called, there is a bug between Java and the operating system libc library. When a specific race condition occurs, the action of finding the host address will continue to loop indefinitely. The frequency of this situation is very low, but once it occurs, it will lead to JVM deadlock, and then all threads in the JVM will be blocked.
Based on the above analysis, the The third critical stack log As follows:
java.lang.Thread.State: RUNNABLE
   at java.net.Inet6AddressImpl.lookupAllHostAddr(Native Method)
   at java.net.InetAddress$2.lookupAllHostAddr(InetAddress.java:928)
   at java.net.InetAddress.getAddressesFromNameService(InetAddress.java:1323)
   at java.net.InetAddress.getAllByName0(InetAddress.java:1276)
   at java.net.InetAddress.getAllByName(InetAddress.java:1192)
   at java.net.InetAddress.getAllByName(InetAddress.java:1126)
   at org.apache.http.impl.conn.SystemDefaultDnsResolver.resolve(SystemDefaultDnsResolver.java:45)
   at org.apache.http.impl.conn.DefaultHttpClientConnectionOperator.connect(DefaultHttpClientConnectionOperator.java:112)
   at org.apache.http.impl.conn.PoolingHttpClientConnectionManager.connect(PoolingHttpClientConnectionManager.java:373)
   at org.apache.http.impl.execchain.MainClientExec.establishRoute(MainClientExec.java:381)
   at org.apache.http.impl.execchain.MainClientExec.execute(MainClientExec.java:237)
   at org.apache.http.impl.execchain.ProtocolExec.execute(ProtocolExec.java:185)
   at org.apache.http.impl.execchain.RetryExec.execute(RetryExec.java:89)
   at org.apache.http.impl.execchain.RedirectExec.execute(RedirectExec.java:111)
   at org.apache.http.impl.client.InternalHttpClient.doExecute(InternalHttpClient.java:185)
   at org.apache.http.impl.client.CloseableHttpClient.execute(CloseableHttpClient.java:83)
   at org.apache.http.impl.client.CloseableHttpClient.execute(CloseableHttpClient.java:56)
   at
   ... ...
How to judge whether IPv6 is enabled in the operating system?
Two methods are introduced:
1)ifconfig
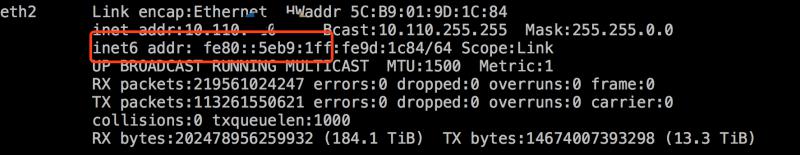
It's obvious that there is inet6 addr This indicates that IPv6 is enabled.
2)lsmod
[root@BJ]# lsmod | grep ipv6
Module                  Size  Used by
ipv6                  335951  73 bridge
Mainly look at the Used column. The value is 70 +, which does not support IPv6 environment. The Used column is 1.
6. Problem optimization scheme summary
After analyzing the status of key threads in the java stack, the cause of the problem is clarified, and then the solution to the problem is described.
First question:
When a connection cannot be obtained from the Http connection pool, the thread may enter a blocking state.
Added in HttpClient client initialization parameter configuration connectionRequestTimeout , The timeout for obtaining connections is generally not recommended to be too large. We set it to 500ms.
After setting, the underlying condition#awaitUtil(deadline) method will be called. When the thread cannot be awakened by signal and reaches the deadline absolute time, the thread will automatically wake up from the waiting queue and join the AQS synchronization queue to compete for the lock.
Second question:
There are two solutions to the JVM process deadlock caused by IPv6:
1) Disable IPv6 at the operating system level
Edit the / etc/sysctl.conf file
Add the following two lines:
net.ipv6.conf.all.disable_ipv6 = 1
net.ipv6.conf.default.disable_ipv6 = 1
Save, execute sysctl -p Make it effective.
Execute the following commands in the operating system to take effect directly:
sysctl -w net.ipv6.conf.all.disable_ipv6=1
sysctl -w net.ipv6.conf.default.disable_ipv6=1
2) Java application level
Add on application JVM startup parameters - Djava.net.preferIPv4Stack=true .
Disable IPv6 from the operating system level. If other applications are deployed on the server, pay attention. If you encounter some problems, you can check them with the help of the search engine.
We have many servers that are maintained by operation and maintenance, so I use the second method to directly add parameters to the JVM, which is simple and convenient.
Final summary:
Two key problems in java stack log WAITING Thread status, appears first WAITING (on object monitor), all threads in the HttpClient thread pool are blocked due to IPv6 problems. Then it appeared WAITING (parking) , Tomcat thread receives the forwarding request. When the request is called to HttpClient, a large number of threads are blocked because the Http connection resources cannot be obtained and the timeout for obtaining the connection is not set.
After optimizing the above two problems, we have been online for a long time, experienced higher traffic than when the problem occurred, and there has been no JVM thread blocking problem again.
Through the network command line statistics, there will be basically no large number of errors CLOSE_WAIT Network connection status.