Recently, Hongxing Erke has been frequently searched
Today, let's use python crawler to see how many hongxingerke stores there are in the country
First, we open the map and search for 'Hongxing Erke'
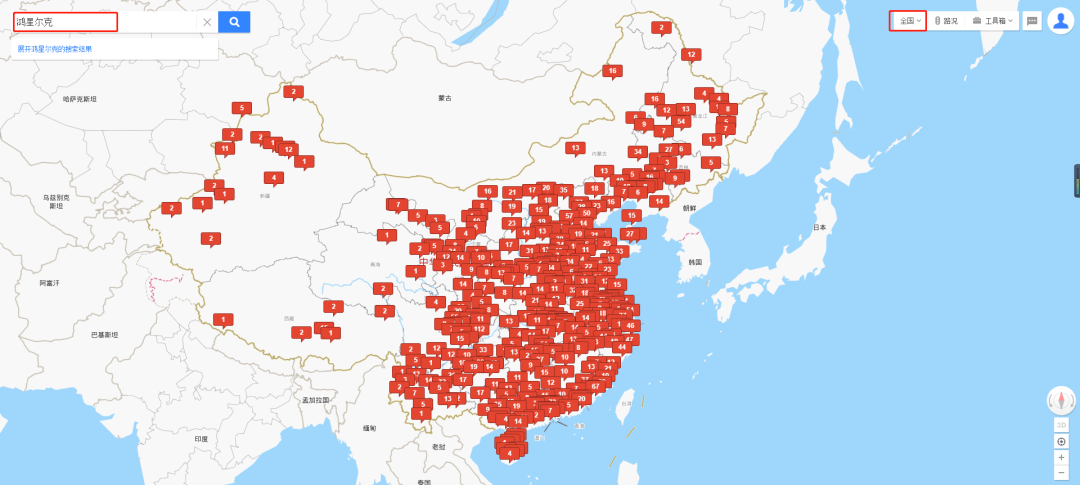
F12 open the browser developer mode and find the following link.
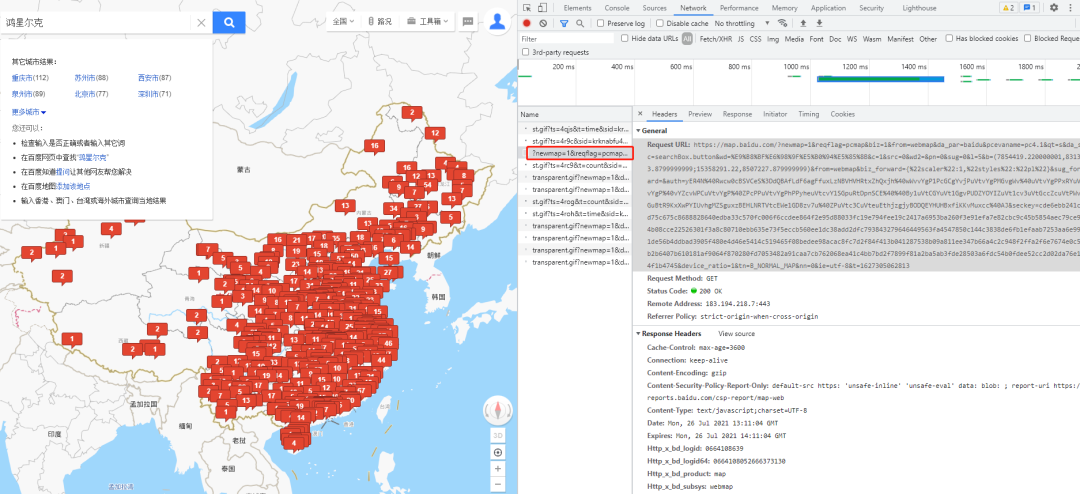
Copy the link to the browser and find that it is a data set in json format. The number of provinces and cities we need and the corresponding number of cities are among them.
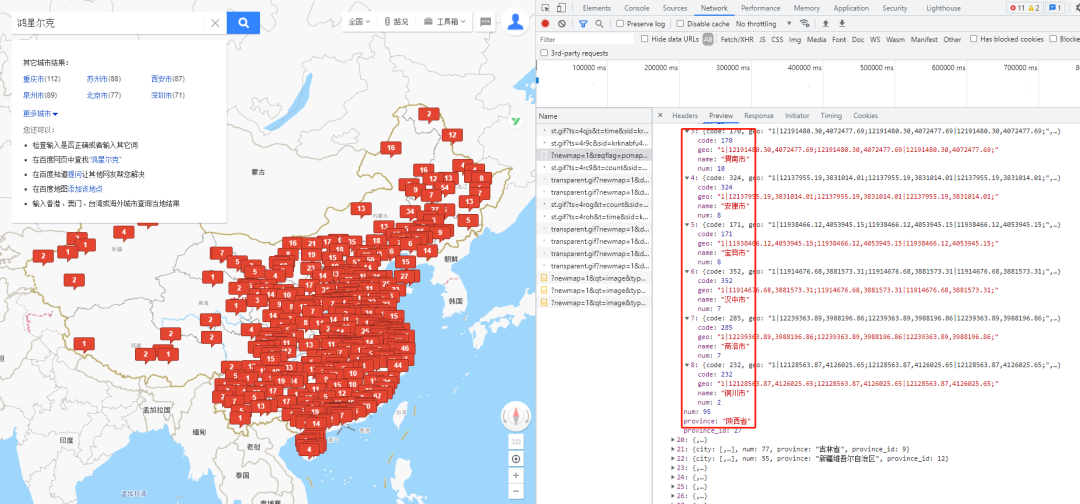
Send request
We first simulate the browser to send a request to obtain the json data set, and then obtain the hongxingerke stores and their corresponding quantities in each city
url = 'https://map.baidu.com/?newmap=1&reqflag=pcmap&biz=1&from=webmap&da_par=baidu&pcevaname=pc4.1&qt=s&da_src=searchBox.button&wd=%E9%B8%BF%E6%98%9F%E5%B0%94%E5%85%8B&c=1&src=0&wd2=&pn=0&sug=0&l=5&b=(7854419.220000001,831323.8799999999;15358291.22,8507227.879999999)&from=webmap&biz_forward={%22scaler%22:1,%22styles%22:%22pl%22}&sug_forward=&auth=yER4N%40Rwcw0cBSVCeS%3DdQBAfLdF6agFfuxLzNBVHVHRtxZhQxjh%40wWvvYgP1PcGCgYvjPuVtvYgPMGvgWv%40uVtvYgPPxRYuVtvYgP%40vYZcvWPCuVtvYgP%40ZPcPPuVtvYgPhPPyheuVtcvY1SGpuRtDpnSCE%40%40By1uVtCGYuVt1GgvPUDZYOYIZuVt1cv3uVtGccZcuVtPWv3GuBtR9KxXwPYIUvhgMZSguxzBEHLNRTVtcEWe1GD8zv7u%40ZPuVtc3CuVteuEthjzgjyBODQEYHUHBxfiKKvMuxcc%40AJ&seckey=cde6ebb241c3d75c675c8688828640edba33c570fc006f6ccdee864f2e95d88033fc19e794fee19c2417a6953ba260f3e91efa7e82cbc9c45b5854aec79ce924b08cce22526301f3a8c80710ebb635e73f5eccb560ee1dc38add2dfc793843279646449563fa4547850c144c3838de6fb1efaab7253aa6e99c1de56b4ddbad3905f480e4d46e5414c519465f08bedee98acac8fc7d2f84f413b041287538b09a811ee347b66a4c2c948f2ffa2f6e7674e0c5cb2b6407b610181af9064f870280fd7053482a91caa7cb762068ea41c4bb7bd2f7899f81a2ba5ab3fde28503a6fdc54b0fdee52cc2d02da76e1a4f1b4745&device_ratio=1&tn=B_NORMAL_MAP&nn=0&ie=utf-8&t=1627305062813'

    headers = {
        'Cookie': 'BIDUPSID=5FDDBE7E96E9CA6D71998093E123403A; PSTM=1627225875; BAIDUID=F934E08738623DF508F108DEF391CFB9:FG=1; BDORZ=B490B5EBF6F3CD402E515D22BCDA1598; BCLID_BFESS=8512773460870798959; BDSFRCVID_BFESS=5UPOJeC62l07libepqHRKmSPxe5rbsOTH6aoyt6boQjiS8lguPwkEG0PHf8g0Ku-S2EqogKKy2OTH9DF_2uxOjjg8UtVJeC6EG0Ptf8g0M5; H_BDCLCKID_SF_BFESS=tJk8_DPbJK-3fP36q4cBb-4WhmT22-us3g7W2hcH0b61EnR_XRQcbJ8LQ-Qi2lJTMITiaKJjBMb1DbRMLfjN5TODKf-DKb3pWDTm_q5TtUJMeCnTDMRh-l04XNbyKMnitIv9-pPKWhQrh459XP68bTkA5bjZKxtq3mkjbPbDfn028DKuDj-WDjJ0DGRf-b-X-I6b0nRH-njfebRNq4nKbICShG4tLlO9WDTm_DostI3SjJoNKbQ10xPD0n3OK6QHKj79-pPKKR7BfKQPhpQ8MqJbhMJtQnbW3mkjbpnDfn02OPKz0T5pKt4syPR8JfRnWn5RKfA-b4ncjRcTehoM3xI8LNj405OTbIFO0KJzJCcjqR8ZDTuBj55P; __yjs_duid=1_695635cb727c238e28cd4254a28a7a0e1627258379781; BAIDUID_BFESS=F934E08738623DF508F108DEF391CFB9:FG=1; __yjs_st=2_NDRiODllYWQzMjBiMzFhYTlmYWVjZTE4NjFkZTM5MmMwODhlZDE0MjVkYWVmMjIzMzc3MWI2Y2RlOTNkMWJkNDBhNmE2YTIyMTJlZjg0ODJiNzk0NDY2NTYxY2NkOGY5YjM5ODViMDAyZjAwY2E0MThjODUyMGM0N2JiMmEyZGEyMTA4ODdkNjViYjcwNDEwODhjNDkzNDg4YjQyMWNjYTI4ZjAzZDllYTg3YjE3ZDRiYWNlMmJkMzc3YjE1OGU5NWU4NjM3YWQxMjkwNDVkMmMyZTM1YTQ5ODgxNTA4ZjE3MDk2YTYwODg5MmY5ZTZlMmYxZGQ5ZTU1OTdkZGYxZV83X2VhYjhlOWZi; H_PS_PSSID=34300_34100_33969_34272_31254_33848_34282_26350_22158; delPer=0; PSINO=3; BA_HECTOR=002h218g2ka58g0lhq1gftcs10r; ab_sr=1.0.1_ZWRlNDJiMzk0ZWQ3YzZmYzgxMmQzOTIyZDBlN2FjZTIxNjIzODliZWE4MzZjZGEwZTBiMTIzNGRmNDhiYmM2NTJhZjI0ZjBkNTFlMjg4MWYxYmY3ZDMzMGVkNmQ1NTNhMDVkN2I1ZGViMDY2ZjBlNWJmOTk4NTBhZGIwOGU4OTg5YzNiM2QwZjVhMTFkYmQ0ODU2NTJkYzNkZmI0ZjI1MA==; PMS_JT=%28%7B%22s%22%3A1627305057015%2C%22r%22%3A%22https%3A//map.baidu.com/@11606355.22%2C4669275.88%2C5.4z%22%7D%29',
        'Referer': 'https://map.baidu.com/search/%E9%B8%BF%E6%98%9F%E5%B0%94%E5%85%8B/@11606355.22,4669275.88,5z?querytype=s&da_src=shareurl&wd=%E9%B8%BF%E6%98%9F%E5%B0%94%E5%85%8B&c=1&src=0&pn=0&sug=0&l=5&b=(6569474.192744261,1360353.0162781863;12256345.744431017,7177600.4441499)&from=webmap&biz_forward=%7B%22scaler%22:1,%22styles%22:%22pl%22%7D&seckey=cde6ebb241c3d75c675c8688828640edba33c570fc006f6ccdee864f2e95d88033fc19e794fee19c2417a6953ba260f3e91efa7e82cbc9c45b5854aec79ce924b08cce22526301f3a8c80710ebb635e73f5eccb560ee1dc38add2dfc793843279646449563fa4547850c144c3838de6fb1efaab7253aa6e99c1de56b4ddbad3905f480e4d46e5414c519465f08bedee98acac8fc7d2f84f413b041287538b09a811ee347b66a4c2c948f2ffa2f6e7674e0c5cb2b6407b610181af9064f870280fd7053482a91caa7cb762068ea41c4bb7bd2f7899f81a2ba5ab3fde28503a6fdc54b0fdee52cc2d02da76e1a4f1b4745&device_ratio=1',
        'User-Agent': 'Mozilla/5.0 (Windows NT 10.0; WOW64) AppleWebKit/537.36 (KHTML, like Gecko) Chrome/93.0.4573.0 Safari/537.36'
    }

    resp = requests.get(url, headers = headers)

    if resp.status_code == requests.codes.ok:
        print(resp.json())
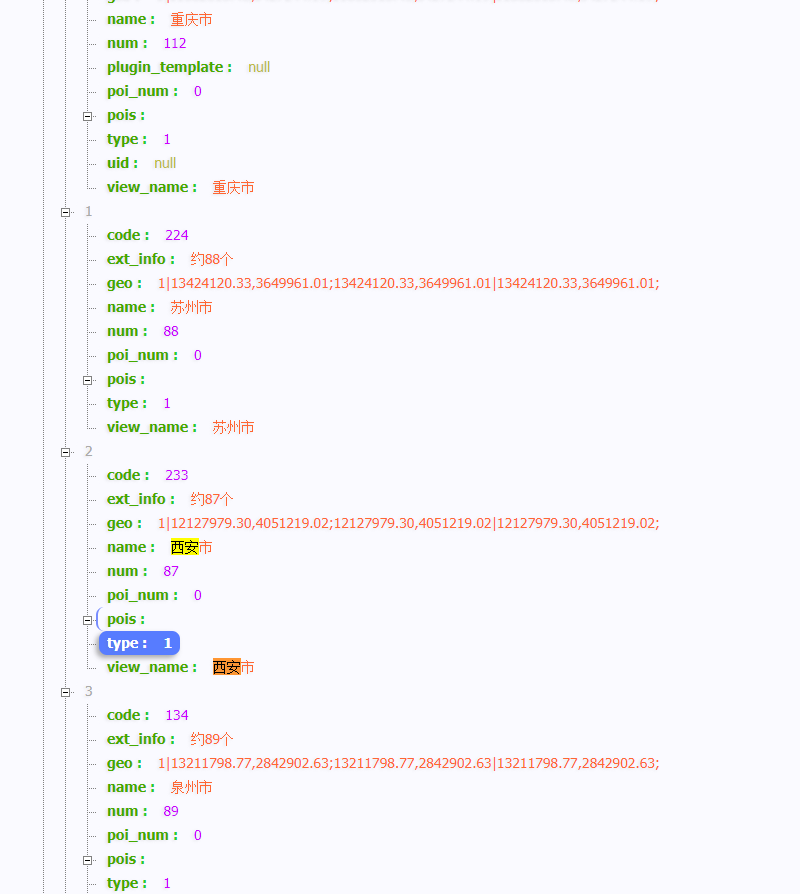
Obtain the corresponding information as follows:

Next, let's get each province and the corresponding quantity, because our country has 23 provinces and municipalities directly under the central government, so we need to get it step by step
China has 34 provincial-level administrative regions, including 23 provinces, 5 autonomous regions, 4 municipalities directly under the central government and 2 special administrative regions.
The 23 provinces are: Hebei, Shanxi, Liaoning, Jilin, Heilongjiang, Jiangsu, Zhejiang, Anhui, Fujian, Jiangxi, Shandong, Henan, Hubei, Hunan, Guangdong, Hainan, Sichuan, Guizhou, Yunnan, Shaanxi, Gansu, Qinghai and Taiwan.
The five autonomous regions are Inner Mongolia Autonomous Region, Guangxi Zhuang Autonomous Region, Tibet Autonomous Region, Ningxia Hui Autonomous Region and Xinjiang Uygur Autonomous Region.
The four municipalities directly under the central government are Beijing, Tianjin, Shanghai and Chongqing.
The two special administrative regions are: Hong Kong Special Administrative Region and Macao Special Administrative Region.

The location of the four municipalities directly under the central government is different from that of other cities, and the distribution is as follows:
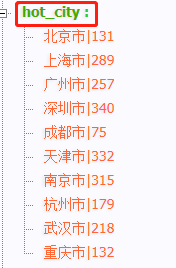
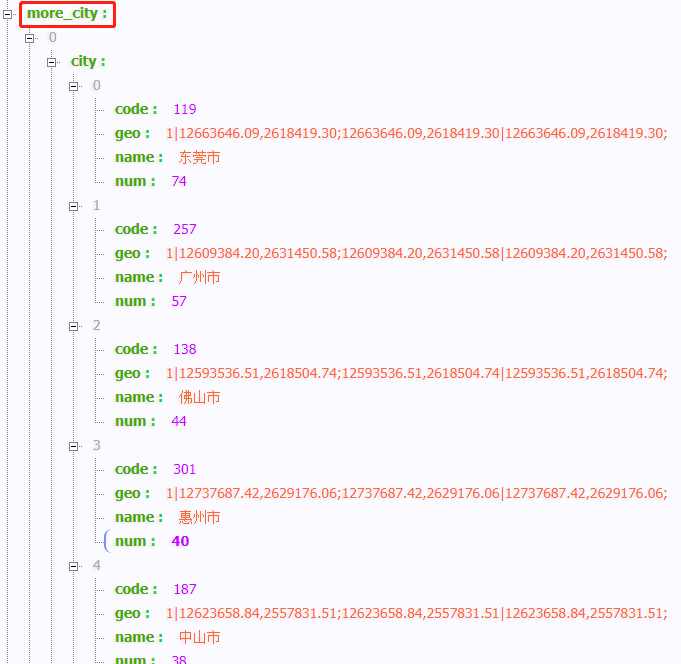
We will save the obtained information in the excel of the province with the following code:
Panda tutorial:
People can not refuse the pandas skills, simple but easy to use!
    prov = []
    value = []

    #  Get four municipalities
    hot_city = datas.json()['hot_city']
    for i in hot_city:
        pv = i.split('|')
        if 'Beijing' in pv[0]:
            prov.append(pv[0])
            value.append(pv[1])

        if 'Shanghai' in pv[0]:
            prov.append(pv[0])
            value.append(pv[1])

        if 'Tianjin' in pv[0]:
            prov.append(pv[0])
            value.append(pv[1])

        if 'Chongqing City' in pv[0]:
            prov.append(pv[0])
            value.append(pv[1])

    #  Print out all province information
    city_list = datas.json()['more_city']
    for item in city_list:
        #  Get the province of hongxingerke
        province = item['province']
        prov.append(province)

        #  Get the number of provinces where hongxingerke is located
        prov_num = item['num']
        value.append(prov_num)


        pd_data = pd.DataFrame({
            'province': prov,
            'quantity':  value,
        })

    pd_data.to_excel('province.xlsx')
    ic('Province information printing completed!')
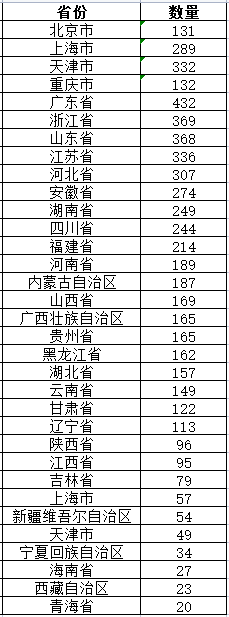
The provincial data stored in excel are as follows:
Similarly, we can obtain the number of honghongxing Erke stores in specific cities in each province
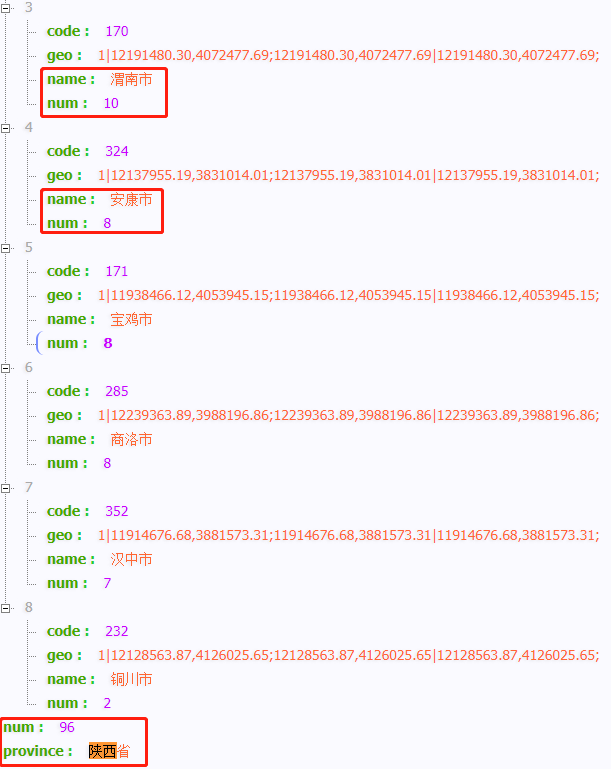
All city information includes
Popular cities + more cities Two parts
city = []
    value = []

    #  Get four municipalities
    hot_city = datas.json()['hot_city']
    for i in hot_city:
        pv = i.split('|')
        if 'Guangzhou City' in pv[0]:
            city.append(pv[0])
            value.append(pv[1])

        if 'Chengdu' in pv[0]:
            city.append(pv[0])
            value.append(pv[1])

        if 'Nanjing City' in pv[0]:
            city.append(pv[0])
            value.append(pv[1])

        if 'Hangzhou' in pv[0]:
            city.append(pv[0])
            value.append(pv[1])

        if 'Wuhan' in pv[0]:
            city.append(pv[0])
            value.append(pv[1])

        if 'Shenzhen City' in pv[0]:
            city.append(pv[0])
            value.append(pv[1])

    #  Print out all city information
    city_list = datas.json()['more_city']

    for item in city_list:
        cities = item['city']

        for i in cities:
            #  Get the urban area of hongxingerke Province
            cit = i['name']
            city.append(cit)
            #  Obtain the corresponding quantity of urban areas in the province where hongxingerke is located
            city_num = i['num']
            value.append(city_num)

            pd_data = pd.DataFrame({
                'city': city,
                'quantity': value,
            })

            pd_data.to_excel('city.xlsx')

    ic('City information printing completed!')
excel stores city data as follows:
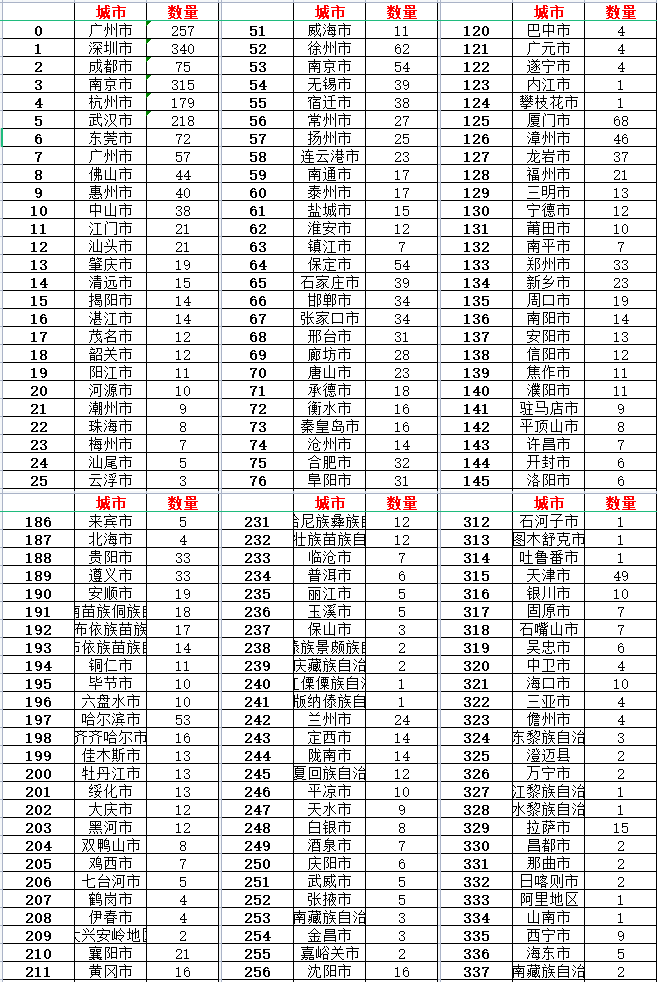
We first use panda to read and clean the data
The main thing is to remove the words "province" and "autonomous region" behind the provinces
#  read file
    pd_data = pd.read_excel('province.xlsx')

    prov = pd_data['province'].tolist()
    prov_num = pd_data['quantity'].tolist()

    name = []
    for i in prov:
        if "province" in i:
            name.append(i.replace('province', ''))
        elif 'Inner Mongolia Autonomous Region' in i:
            name.append(i.replace('Autonomous Region', ''))
        else:
            name.append(i[:2])
    ic(name)
    ic(prov)

    '''
    2021-07-27 20:50:50.752477|name: ['Beijing',
                                  'Shanghai',
                                  'Tianjin',
                                  'Chongqing',
                                  'Guangdong',
                                  'Zhejiang',
                                  'Shandong',
                                  'Jiangsu',
                                  'Hebei',
                                  'Anhui',
                                  'Hunan',
                                  'Sichuan',
                                  'Fujian',
                                  'Henan',
                                  'Inner Mongolia',
                                  'Shanxi',
                                  'Guangxi',
                                  'Guizhou',
                                  'Heilongjiang',
                                  'Hubei',
                                  'Yunnan',
                                  'Gansu',
                                  'Liaoning',
                                  'Shaanxi',
                                  'Jiangxi',
                                  'Jilin',
                                  'Shanghai',
                                  'Xinjiang',
                                  'Tianjin',
                                  'Ningxia',
                                  'Hainan',
                                  'Tibet',
                                  'Qinghai']
2021-07-27 20:50:50.752477|prov: ['Beijing',
                                  'Shanghai',
                                  'Tianjin',
                                  'Chongqing City',
                                  'Guangdong Province',
                                  'Zhejiang Province',
                                  'Shandong Province',
                                  'Jiangsu Province',
                                  'Hebei Province',
                                  'Anhui Province',
                                  'Hunan Province',
                                  'Sichuan Province',
                                  'Fujian Province',
                                  'Henan Province',
                                  'Inner Mongolia Autonomous Region',
                                  'Shanxi Province',
                                  'Guangxi Zhuang Autonomous Region',
                                  'Guizhou Province',
                                  'Heilongjiang Province',
                                  'Hubei province',
                                  'Yunnan Province',
                                  'Gansu Province',
                                  'Liaoning Province',
                                  'Shaanxi Province',
                                  'Jiangxi Province',
                                  'Jilin Province',
                                  'Shanghai',
                                  'Xinjiang Uygur Autonomous Region',
                                  'Tianjin',
                                  'Ningxia Hui Autonomous Region',
                                  'Hainan ',
                                  'Tibet Autonomous Region',
                                  'Qinghai Province']
    '''
Next, we use pyecarts to visualize our cleaned data
map = (
      Map()
      .add("Quantity distribution", [list(z) for z in zip(prov, prov_num)], "china")
      .set_global_opts(
      title_opts=opts.TitleOpts(title="Distribution map of hongxingerke stores nationwide"),
      visualmap_opts=opts.VisualMapOpts(max_=500, is_piecewise=True),
      )

  )
  map.render('province.shtml')
  ic('The provincial distribution map has been drawn!')
The renderings are as follows:
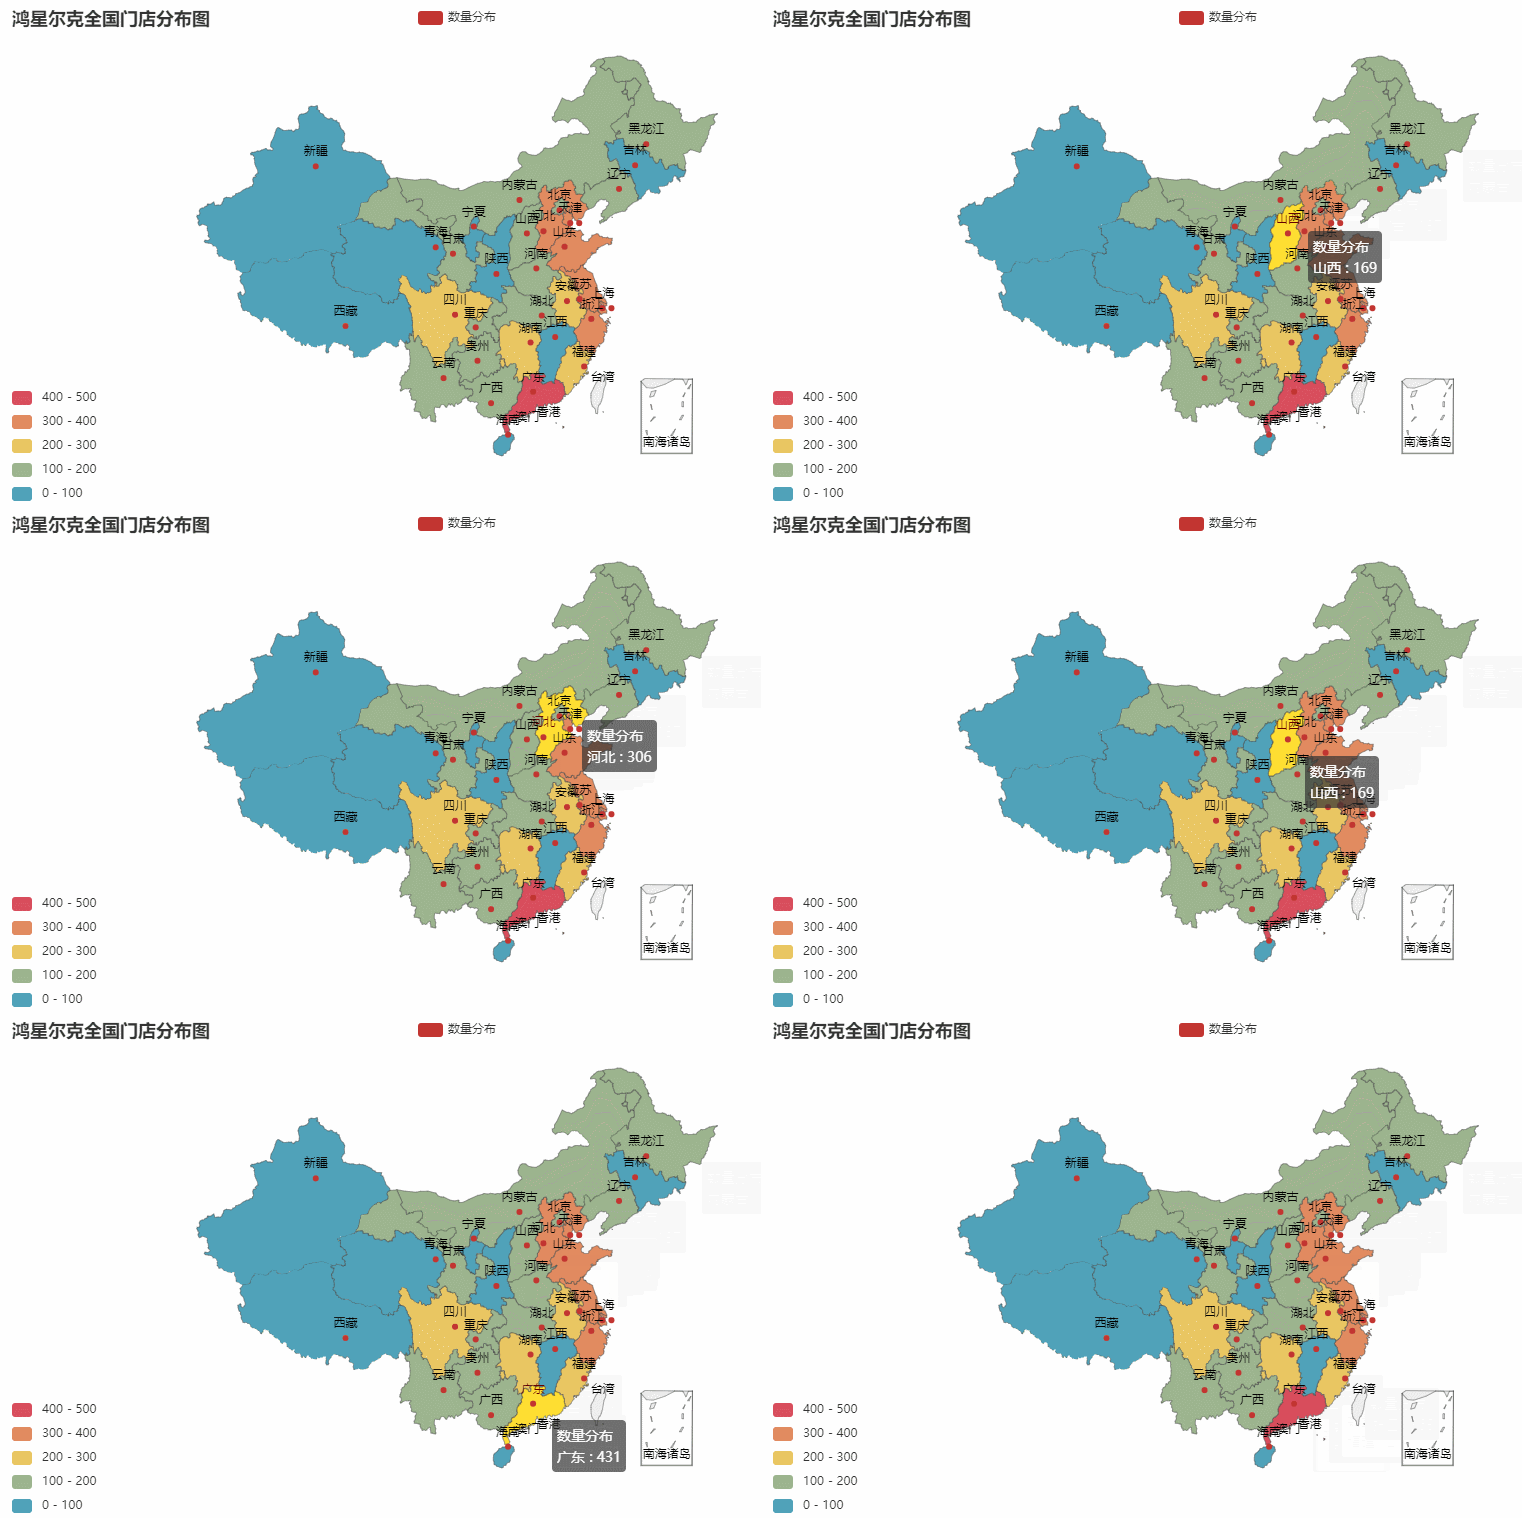
The same is true for each city map where the province is located. We take Guangdong, which has the most stores, as an example. You can also choose any province
Grab data - > store data - > process data - > visualize data
The final effect is as follows:
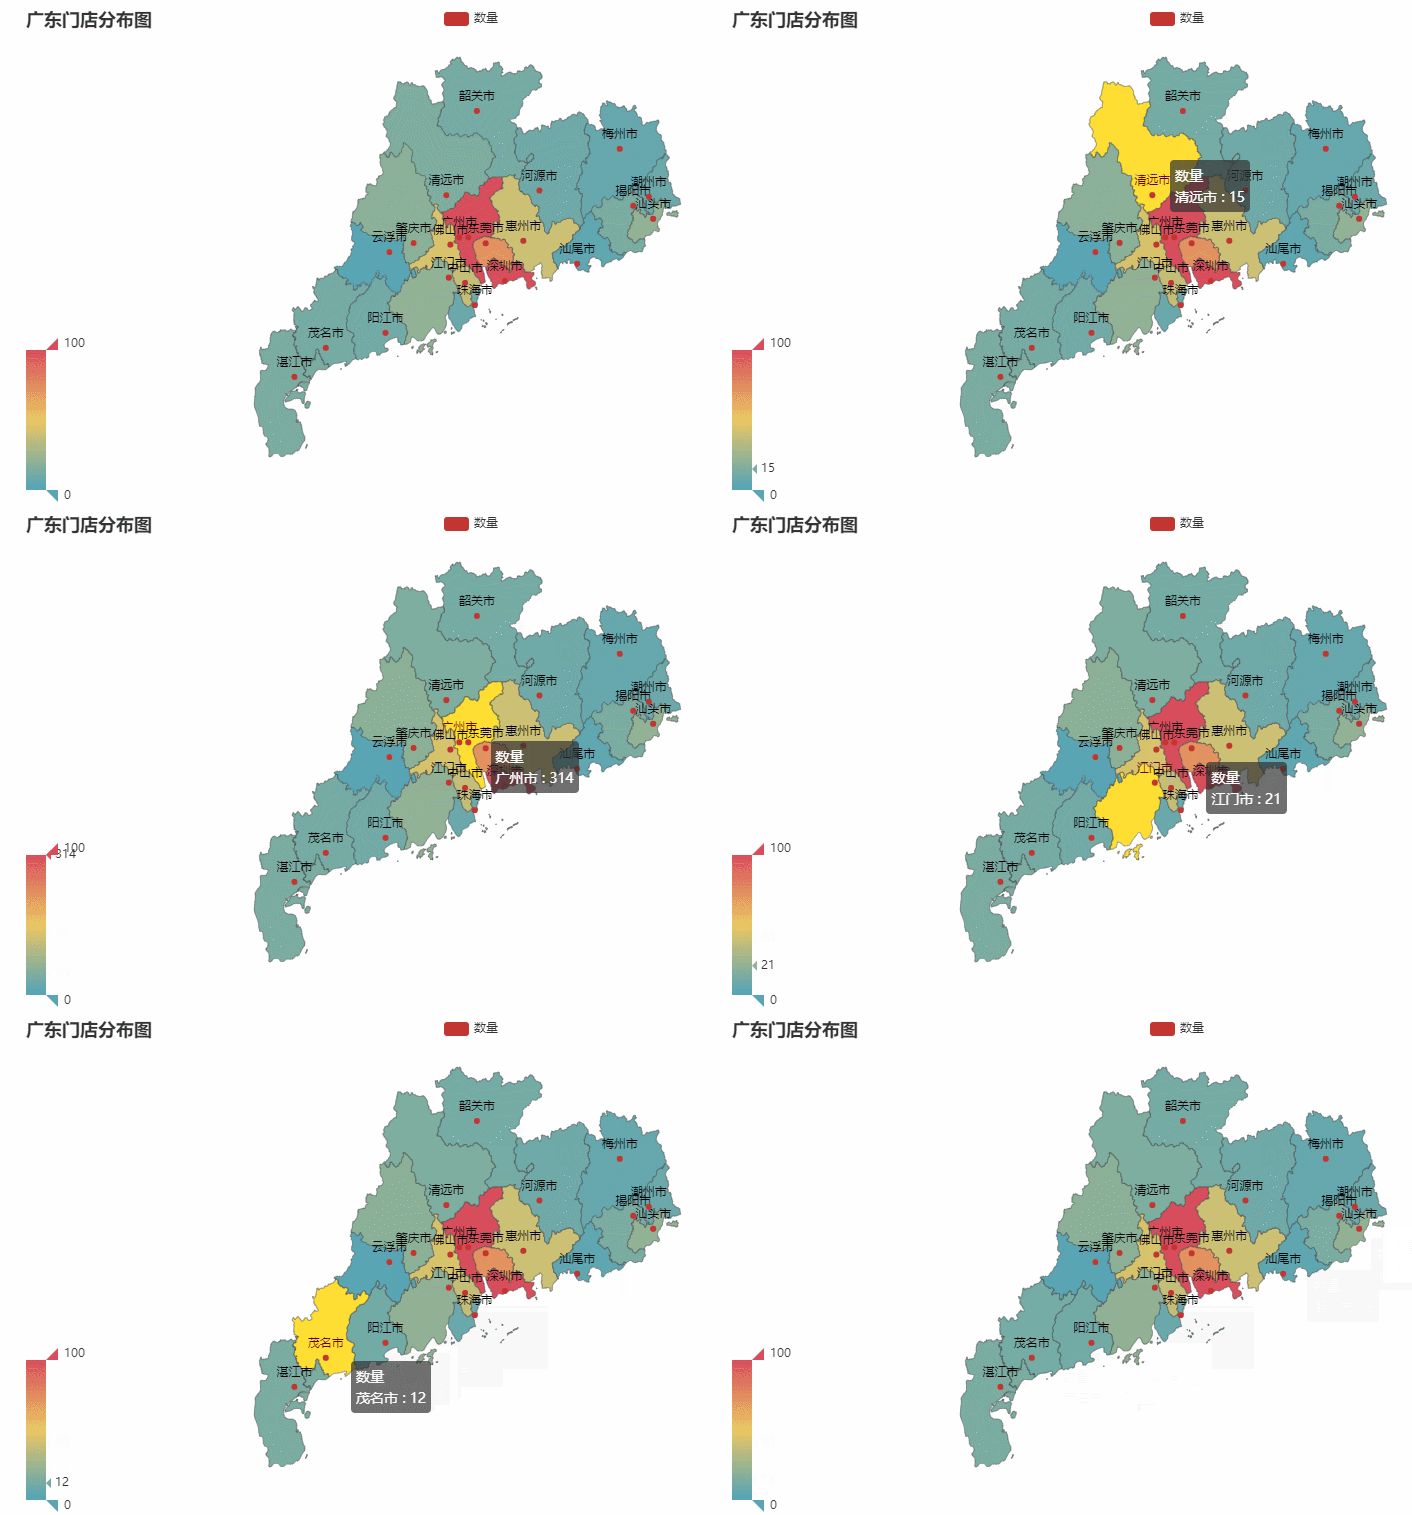
After data visualization, it is clear at a glance, which is more pleasing to the eye than looking at excel. And get twice the result with half the effort.