In the age of python, you have to learn some Python in finance, personnel, administration and other posts, which is easy and brain-saving!
All operations are automatically implemented in Python, overtime? It doesn't exist!
 In fact, excel and python are both tools. We don't need to compare them and study which is easy to use. excel, as the most widely used data processing tool in the world, has monopolized for many years. It must have its own advantages in data processing. Python only makes some huge and time-consuming operations accelerate processing and facilitate work.
Of course, there are many excel operations that are simpler and more convenient than automatic processing with Python.
For example, sum the columns and display them in the bottom row. excel is to add a sum() function to a column and then pull it to the left to solve it. python needs to define a function. python needs to judge the format. If it is not numerical data, it will be used directly. I won't give examples one by one!
All right, let's get to the point.
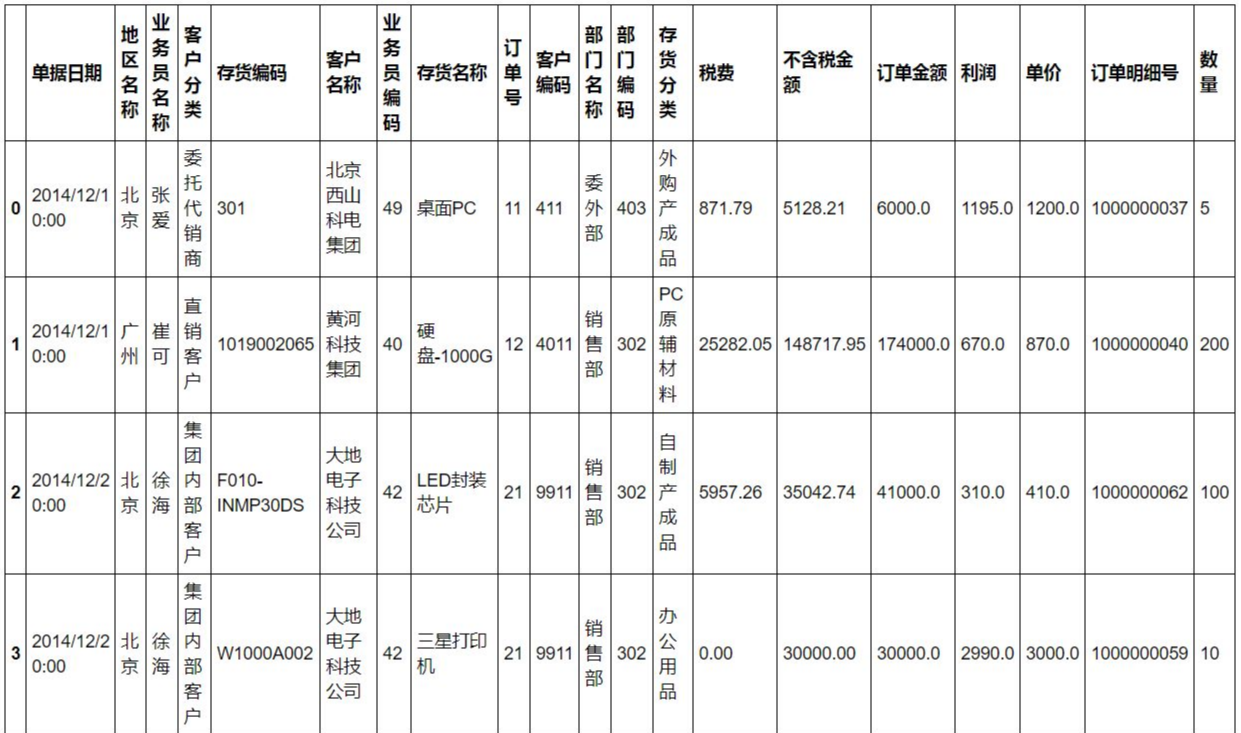
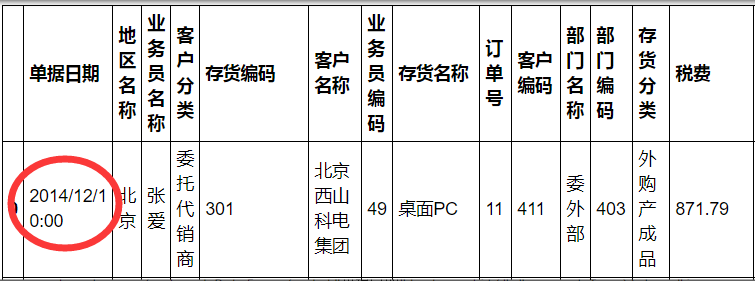
The sales data found on the Internet is almost like this.
Sales data
 1. PivotTable report
demand
Want to know the total profit and average profit earned by the salesperson in each region
pd.pivot_table(sale,index="Region name",columns="Salesman name",values="profit",aggfunc=[np.sum,np.mean])
Brothers learn python. Sometimes they don't know how to learn and where to start. After mastering some basic grammar or doing two cases, I don't know what to do next or how to learn more advanced knowledge.
So for these big brothers, I have prepared a large number of free video tutorials, PDF e-books, and the source code of the video source!
There will be big guys to answer!
It's all in this skirt Click me to enter quickly
Welcome to join, discuss and study together!
2. Remove duplicate values
demand
Remove duplicate values of operator codes
sale.drop_duplicates("Business representative code",inplace=True)
3. Subtotal
demand
Total profit of each salesman in Beijing
sale.groupby(["Region name","Salesman name"])["profit"].sum()
4. Association formula: Vlookup
vlookup is almost the most commonly used formula in excel. It is generally used for the associated query of two tables.
So I'll divide this table into two tables first.
df1=sale[['Order detail No','Document date','Region name', 'Salesman name','Customer classification', 'Inventory code', 'Customer name', 'Business representative code', 'Inventory name', 'order number',
       'Customer code', 'Department name', 'Department code']]
df2=sale[['Order detail No','Inventory classification', 'taxation', 'Amount excluding tax', 'Order amount', 'profit', 'Unit Price','quantity']]
demand
Would you like to know the profit corresponding to each order of df1
The profit column exists in the table of df2, so I want to know the profit corresponding to each order of df1.
If you use excel, first confirm that the order detail number is the unique value, then add a new column in df1 and write: = vlookup(a2,df2!a:h,6,0), and then pull down to ok.
How is it implemented in python?
#Check whether the order detail number is repeated, and the result is No.
df1["Order detail No"].duplicated().value_counts()
df2["Order detail No"].duplicated().value_counts()

df_c=pd.merge(df1,df2,on="Order detail No",how="left")
5. Conditional calculation
demand
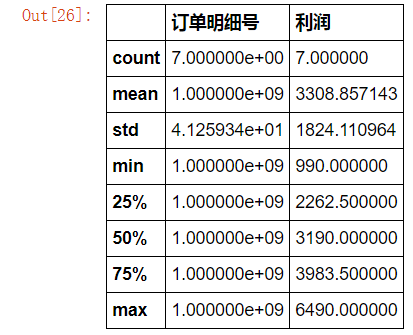
How many orders with inventory name containing "Samsung" and tax higher than 1000?
What is the total profit and average profit of these orders? (or minimum, maximum, quartile, label difference)
sale.loc[sale["Inventory name"].str.contains("Samsung")&(sale["taxation"]>=1000)][["Order detail No","profit"]].describe()
 6. Grouping
demand
According to the distribution of profit data, regions are divided into "poor", "medium", "good" and "very good"
First of all, of course, check the data distribution of profits. Here we use the quartile to judge.
sale.groupby("Region name")["profit"].sum().describe()
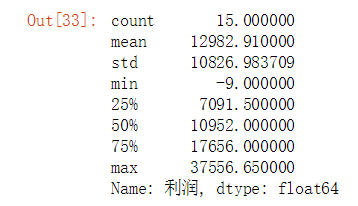 According to the quartile, the regional total profit of [- 97091] is classified as "poor" and that of (709110952) is classified as "medium"
(1095217656] is good, and (1765637556] is very good.
#First create a Dataframe
sale_area=pd.DataFrame(sale.groupby("Region name")["profit"].sum()).reset_index()

#Set bins, and group name
bins=[-10,7091,10952,17656,37556]
groups=["Poor","secondary","preferably","very nice"]

#Grouping with cut
#Sale_area ["group"] = pd.cut(sale_area ["profit"], bins,labels=groups)
7. Compare the differences between the two columns
Because the data dimensions of each column in this table are different, it makes no sense to compare, so I first make a difference in the order detail number and then compare it.
Demand: compare and display the difference between order detail No. and order detail No. 2.
sale["Order detail No. 2"]=sale["Order detail No"]

#In order detail No. 2, the first 10 are + 1
sale["Order detail No. 2"][1:10]=sale["Order detail No. 2"][1:10]+1

#Differential output
result=sale.loc[sale["Order detail No"].isin(sale["Order detail No. 2"])==False]
8. Outlier replacement
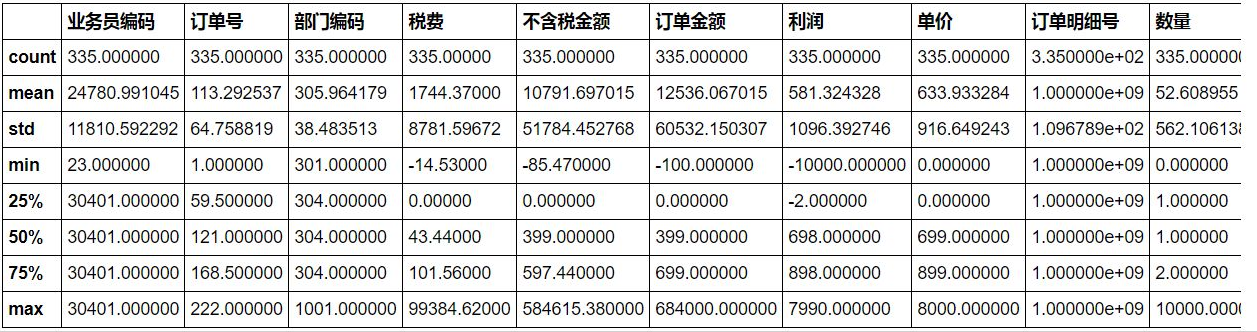
First, use the describe() function to simply check whether the data has abnormal values.
#It can be seen that the output tax has a negative value, which is generally not the case. It is regarded as an abnormal value.
sale.describe()
 demand
Replace outliers with 0.
sale["Order amount"]=sale["Order amount"].replace(min(sale["Order amount"]),0)
9. Missing value processing
First, check which columns of sales data have missing values
#If the number of rows in the column is less than the number of rows in the index, there is a missing value. Here, the customer name 329 < 335 indicates that there is a missing value
sale.info()

demand
Fill in the missing value with 0 or delete the line with the missing value of customer code
In fact, the missing value processing method is very complex. Only simple processing methods are introduced here. If it is a numerical variable, it is most commonly used to process the average or median or mode. For more complex ones, the random forest model can be used to predict the results according to other dimensions.
If it is a classification variable, it is more accurate to fill it according to the business logic.
For example, fill in the missing value of customer name in the demand here: it can be filled according to the customer name corresponding to the inventory with the most frequent inventory classification.
Here we use a simple method: fill in the missing value with 0 or delete the row with the missing value of customer code.
#Fill missing values with 0
sale["Customer name"]=sale["Customer name"].fillna(0)
#Delete lines with missing customer code values
sale.dropna(subset=["Customer code"])
10. Data breakdown
demand
Disaggregate date and time
sale=pd.merge(sale,pd.DataFrame(sale["Document date"].str.split(" ",expand=True)),how="inner",left_index=True,right_index=True)
11. Fuzzy filtering data
demand
The screening inventory name contains "Samsung" or "Sony"
sale.loc[sale["Inventory name"].str.contains("Samsung|Sony")]
12. Delete spaces between data
demand
Delete the space around the inventory name
sale["Inventory name"].map(lambda s :s.strip(""))
13. Define labels according to business logic
demand
The information of goods with a sales profit margin (i.e. profit / order amount) greater than 30% and marked as high-quality goods, and less than 5% as general goods.
sale.loc[(sale["profit"]/sale["Order amount"])>0.3,"label"]="High quality goods"
sale.loc[(sale["profit"]/sale["Order amount"])<0.05,"label"]="General merchandise"
14. Multi condition filtering
demand
I'd like to know the information of salesman Zhang Ai that the order amount of goods sold in Beijing is greater than 6000.
sale.loc[(sale["Region name"]=="Beijing")&(sale["Salesman name"]=="Zhang Ai")&(sale["Order amount"]>5000)]
Here are just some commonly used, but there are still many operations commonly used in excel. If you want to realize any more operations, you can communicate together in the comment area. If you have a better way to write these operations, you can also communicate together in the comment area! Thank you!

.