Pytoch machine learning (IX) -- anchor box and prediction box in YOLO, generating candidate regions and labeling candidate regions in detail
catalogue
preface
The first step in target detection in YOLO or one stage is to generate candidate regions. How to generate candidate regions is the core problem in the field of target detection, and the generation of candidate regions can be divided into the following two steps
- According to certain rules, a series of anchor boxes with fixed positions are generated on the picture, and these anchor boxes are regarded as possible candidate areas.
- Predict whether the anchor box contains the target object. If it contains the target object, it is also necessary to predict the category of the included object and the range of adjustment of the prediction box relative to the anchor box position.
This article mainly explains the above two steps. The following code is written with reference to the source code of Baidu course and YOLOV5.
Just want to understand the concept, just look at the front. The second part is mainly the code.
1, Basic concepts
Before introducing the following contents, let's briefly introduce some basic concepts. The anchor box and prediction box are easy to be confused in the future. Please pay more attention.
1. bounding box
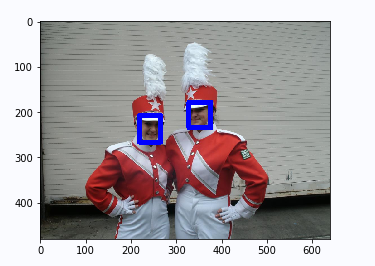
In target detection, the position of the object is represented by a bounding box, which is a rectangular box that can contain the object exactly. As shown in the figure below, the rectangular box containing the position of the face is the bounding box.
The bounding box mainly has the following two forms.
xyxy format
That is, the bounding box is represented by the upper left corner coordinates (x1, y1) and the lower right corner coordinates (x2, y2)
xywh format
That is, the bounding box is represented by the central coordinates (x, y) and the length and width (w, h) of the box. This form is mainly used in YOLO.
When we train, we also call the boundary box ground true box
2. anchor box
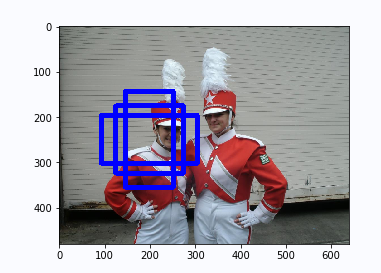
Anchor frame is different from object boundary frame. It is a kind of frame imagined by people. First set the size and shape of the anchor box, and then draw a rectangular box centered on a point on the image.
In YOLO, the generation rule is to divide the picture into mxn areas, and then generate a series of anchor boxes in the center of each grid according to the set aspect ratio.
Here, the set length and width are generated by clustering in YOLO, while in yoov5, they are calculated by k-means clustering + genetic algorithm and updated later.
In the target detection task, a series of anchor boxes are usually generated on the image according to some rules, and these anchor boxes are regarded as possible candidate areas. The model predicts whether these candidate regions contain objects. If they contain target objects, it needs to further predict the category of objects. Another more important point is that because the anchor frame position is fixed, it is unlikely to coincide with the object boundary frame. Therefore, fine adjustment needs to be made on the basis of the anchor frame to form a prediction frame that can accurately describe the object position. The model needs to predict the fine adjustment range.
Simply put, the anchor box is equivalent to the initialization weight of the network for the prediction box.
3. prediction box box)
The prediction box is the fine-tuning result of the anchor box. The result is closer to the real box. The problem is how to fine tune the anchor box to get better results. In YOLO, the following methods are mainly used to fine tune the anchor frame.
Central target generation
According to the generation method of anchor box, it is generated with a certain length width ratio based on the central coordinate of a divided grid, but in YOLO, the prediction box is offset with the upper left corner coordinate of a grid as the origin.
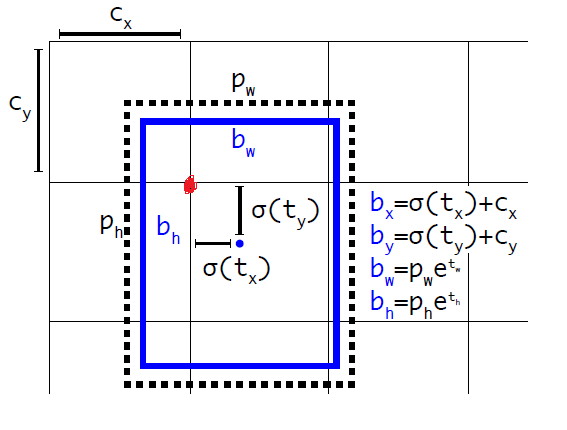
The coordinates of the upper left corner of the grid in the figure are (cx, cy) , Then the center coordinate in the prediction box is (bx, by), where
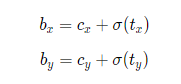
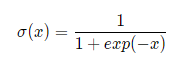
From the sigmoid function, we can see that its function value is between (0, 1), and the central coordinates of bx and by must be in this divided lattice.
Length width generation
For the generation of the length and width of the prediction frame, it is generated based on the initial length and width of the anchor frame (pw, ph) with the following formula (bw, bh)
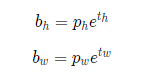
From the above formula, we can know that our network is actually predicting the values of tx, ty, th and tw. Since we know the bx, by, bh, bw of the real box, it is easy to know the real box tx *, ty *, th *, TW * from the inverse function, then one of the boundary boxes of our network loss is calculated as tx, ty, th, TW and tx *, ty *, th *, TW *, and the loss will be described in detail next time.
Let's briefly explain why we use this method to get bx, by, bh and bw. In fact, sigmoid and e-exponential functions are mainly used, which have no constraints on the output of the network.
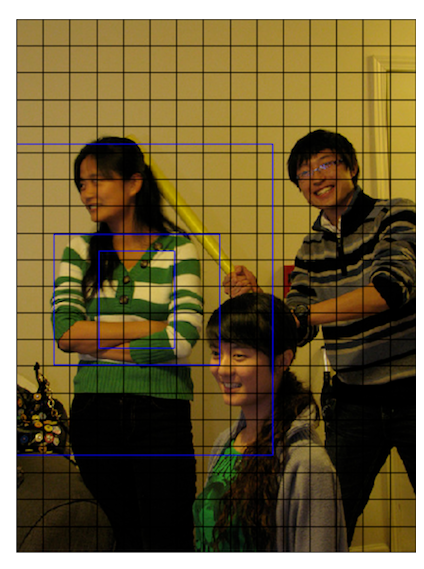
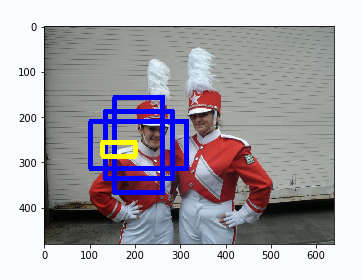
The yellow box in the figure below shows one of the anchor box es with tx = 3,ty = 0.3,tw = 0.3,th = 0.2 generated forecast box.
4. Label candidate areas
Here are many concepts about anchor box and prediction box. Please pay attention to the difference!
Each anchor box may be a candidate area, but we know from the above content that a picture will generate many anchor boxes. How to determine which one we need, we mainly consider the following three aspects.
-
Objectness tag: whether the anchor box contains objects can be regarded as a binary classification problem. When the anchor box contains objects, objectness=1, indicating that the prediction box belongs to the positive category; When the anchor box does not contain objects, set objectness=0, indicating that the anchor box belongs to negative class.
-
location tag: if the anchor box contains objects, what should be the center position and size of its corresponding prediction box, or what should be tx,ty,tw,th in the above calculation formula.
-
Label label: if the anchor box contains objects, what is the specific category.
objectness tag
We mainly use IOU or GIOU and other indicators to judge whether the anchor box contains objects. For IOU and GIOU, you can see my following article. In the following explanations, I use IOU as the index to evaluate the objectness tag.
Pytorch machine learning (V) -- loss function in target detection (l2, IOU, GIOU, DIOU, CIOU)
We can calculate the IOU between all our anchor boxes and real boxes, and then select n anchor boxes (n is the number of real boxes) according to the evaluation index IOU
We mark the objectness tag of these n anchor boxes as 1 and the others as 0
However, in YOLO, for some anchor boxes with large IOU, set a threshold. If the IOU is greater than this threshold, mark the objectness tag as - 1 instead of 0
In the prediction, we only need to predict the location tag and label tag according to the anchor box with objectness tag 1!!
location tag
For the location tag, that is, if the objectness tag is 1, mark the four values of its real box tx *, ty *, th *, tw *. Note that tx *, ty *, th *, tw of the real box are marked here*
Label label
For the label label, we use one hot coding. For example, if there are four categories, it will be marked as [0, 0, 0, 1] (assuming that it is the fourth category)
From this, we can see that for the annotation of candidate boxes, we need a total of 1 (object tag) + 4 (location tag) + n (number of categories - label tag) parameters.
Our network also has so many parameters for each prediction frame!! This is very important for understanding the network output later!!
2, Code explanation
For how to generate the anchor box, the functions marked with the candidate box are as follows. The code is relatively long and the comments I have written are relatively complete. After reading them step by step, I will have a deeper understanding of the above contents.
# Label the objectness of the prediction box
def get_objectness_label(img, gt_boxes, gt_labels, iou_threshold = 0.7,
                         anchors = [116, 90, 156, 198, 373, 326],
                         num_classes=7, downsample=32):
    """
    img Is the input image data, and the shape is[N, C, H, W]
    gt_boxes,True box, dimension is[N, 50, 4],Where 50 is the upper limit of the number of real frames. When there are less than 50 real frames in the picture, the coordinates of the insufficient part are all 0
              The real box coordinate format is xywh,Relative values are used here
    gt_labels,The category of the real box. The dimension is[N, 50]
    iou_threshold,When the predicted box is different from the real box iou greater than iou_threshold It is not regarded as a negative sample
    anchors,Optional dimensions of anchor frame
    anchor_masks,Through and anchors Determine together what size anchor frame should be selected for the characteristic drawing of this level
    num_classes,Number of categories
    downsample,The scale of the change of the feature map relative to the picture size of the input network
    """

    img_shape = img.shape
    batchsize = img_shape[0]
    # The anchors here are grouped in pairs, indicating length and width respectively
    num_anchors = len(anchors) // 2
    input_h = img_shape[2]
    input_w = img_shape[3]
    # Divide the input picture into num_rows x num_cols is a small square area, and the side length of each small square is downsample
    # Calculate the total number of rows of small squares
    num_rows = input_h // downsample
    # Calculate how many columns of small squares there are
    num_cols = input_w // downsample
    # Initialize all 0 for the return value
    label_objectness = np.zeros([batchsize, num_anchors, num_rows, num_cols])
    label_location = np.zeros([batchsize, num_anchors, 4, num_rows, num_cols])
    label_classification = np.zeros([batchsize, num_anchors, num_classes, num_rows, num_cols])
    # Here's a scale_location, which is used to adjust the weight of large targets and small targets
    # Large target and small target are more sensitive to the same offset, so the weight coefficient is enhanced
    scale_location = np.ones([batchsize, num_anchors, num_rows, num_cols])

    # Cycle the batchsize and process each picture in turn
    for n in range(batchsize):
        # Loop the real box on the picture and find the anchor box that best matches the shape of the real box in turn
        for n_gt in range(len(gt_boxes[n])):
            gt = gt_boxes[n][n_gt]
            # Category of real box
            gt_cls = gt_labels[n][n_gt]
            # Center coordinates, length and width of real frame (xywh is adopted in YOLO)
            gt_center_x = gt[0]
            gt_center_y = gt[1]
            gt_width = gt[2]
            gt_height = gt[3]
            # If the real frame is too small, the label is considered damaged
            if (gt_width < 1e-3) or (gt_height < 1e-3):
                continue
            # Calculate which grid the center point of the real box falls in
            i = int(gt_center_y * num_rows)
            j = int(gt_center_x * num_cols)
            ious = []
            for ka in range(num_anchors):
                # x. Y is 0 because the X and y of the anchor box and the real box are the same
                bbox1 = [0., 0., float(gt_width), float(gt_height)]
                # Generate the anchor box in the grid of input (i, j)
                anchor_w = anchors[ka * 2]
                anchor_h = anchors[ka * 2 + 1]
                bbox2 = [0., 0., anchor_w/float(input_w), anchor_h/float(input_h)]
                # Calculate iou
                iou = box_iou_xywh(bbox1, bbox2)
                ious.append(iou)
            ious = np.array(ious)
            # Calculate the index of the maximum iou
            inds = np.argsort(ious)
            k = inds[-1]
            label_objectness[n, k, i, j] = 1
            c = gt_cls
            label_classification[n, k, c, i, j] = 1.

            # for those prediction bbox with objectness =1, set label of location
            # Inverse the tx *, ty *, tw *, th of the real box*
            dx_label = gt_center_x * num_cols - j
            dy_label = gt_center_y * num_rows - i
            dw_label = np.log(gt_width * input_w / anchors[k*2])
            dh_label = np.log(gt_height * input_h / anchors[k*2 + 1])
            label_location[n, k, 0, i, j] = dx_label
            label_location[n, k, 1, i, j] = dy_label
            label_location[n, k, 2, i, j] = dw_label
            label_location[n, k, 3, i, j] = dh_label
            # scale_location is used to adjust the contribution of anchor frames of different sizes to the loss function, which is multiplied by the weighting coefficient and the position loss function
            # According to this calculation method, it can be concluded that the larger the real box is, the smaller the weight is
            scale_location[n, k, i, j] = 2.0 - gt_width * gt_height

    # At present, according to all GT boxes that appear in each picture, the prediction box with positive objectness is marked, and the remaining prediction boxes default objectness to 0
    # For the prediction boxes with objectness of 1, the object categories they contain and the targets of position regression are marked
    return label_objectness.astype('float32'), label_location.astype('float32'), label_classification.astype('float32'), \
             scale_location.astype('float32')
summary
There are many concepts involved, and based on my own understanding, if there is any error, welcome to discuss and correct.