See the end of the text for the code
1. Purpose and content of the experiment
1.1 experimental purpose
Three line segment generation algorithms (DDA, improved Bresenham line drawing algorithm and improved midpoint line drawing algorithm) are realized through Python language, the core ideas of the three algorithms are deeply understood, and the line segments generated by the three algorithms and their execution efficiency are compared.
1.2 experimental contents
Three line segment generation algorithms (DDA, midpoint line drawing, improved Bresenham line drawing algorithm) are used to solve the problem of drawing the line given the points A(x0,y0) and B(x1,y1) at both ends of any line segment, and the line segments generated by the three algorithms and their execution efficiency are compared.
2. Algorithm principle
2.1 basic principle of DDA (numerical differential algorithm)
Select the larger absolute value of x1-x0 and y1-y0 as the step direction (assuming that x1-x0 is large), take △ X in this direction as a pixel unit length, that is, x increases by one pixel each time, then calculate the corresponding y value by using the formula yi+1=yi+(y1-y0)/(x1-x0) * △ x, and output the calculated (xi+1, yi+1) to the display in sequence after rounding to obtain the rasterized straight line. The reason why the larger absolute values of x1-x0 and y1-y0 are taken as the stepping direction is that if the smaller is taken as the stepping direction, the straight line will be discontinuous.
2.2 basic principle of improved Bresenham line drawing algorithm
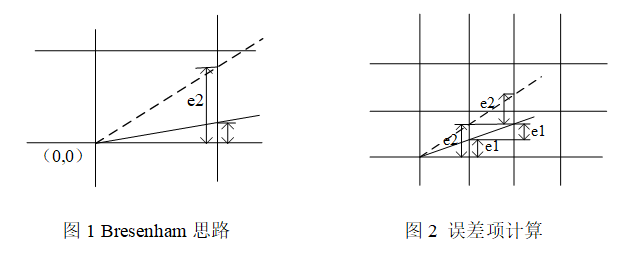
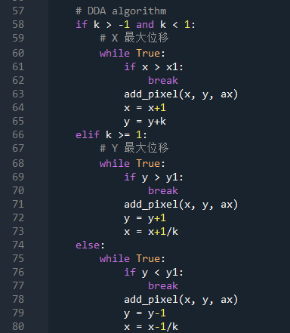
For the implementation of any slope, please refer to the implementation steps. Here, only the straight line between slope 0 and 1 is explained. Through the design, the actual increment value can be determined by checking the symbol of the error term every time. Take the straight line with slope 0 < = k < = 1 as an example, as shown in Figure 1. If the slope of the straight line passing through (0,0) is greater than 1 / 2, i.e. E > 1 / 2 (E 2 as shown in Fig. 1), its intersection with the x=1 straight line is closer to the y=1 straight line than the y=0 straight line, so the pixel point (1,1) shall be taken. If the slope is less than 1 / 2, i.e. E. e < 1 / 2 (E 1 as shown in Fig. 1), the pixel point (1,0) shall be taken. When the slope is equal to 1 / 2, that is, e=1/2, any one can be selected. Only if the selection of the whole algorithm is consistent, the algorithm selects (1,1) pixels. In order to simplify the judgment, e '= e- 1/2 (the first step of optimization) can be set, so as long as the symbol of E' is judged. First, let the initial value of the error term be - 1 / 2. If e '= △ Y / △ x-1/2 is greater than or equal to zero, then x plus 1 and y plus 1; If it is less than zero, x plus 1, the value of Y remains the same. For the calculation of the error term in the next step, there are generally two cases. As shown in Fig. 2, add one step for e '≥ 0 and Y (as shown in Fig. 2 for e2), and the new error term e"=e' + △ Y / △ x-1 (at this time, the distance of more than one pixel point needs to be reduced by 1. In Fig. 2, in fact, e"=2e '- 3 / 2, which is less than zero, so (2,1) pixel points should be taken); For e '< 0, y does not walk (as shown in e1 in Figure 2), e"=e' + △ Y / △ x (as shown in Figure 2, in fact, e"=2e1- 1/2. At this time, it is greater than zero, and (2,1) pixels should also be taken). In fact, the value of the error term e 'has nothing to do with the execution of the algorithm, only with the symbol of E'. Therefore, the second optimization is carried out. Multiply 2 △ x on both sides of E '= △ Y / △ x-1/2 to eliminate the division operation: let the initial e' = 2 * △ Y - △ X; If e ≥ 0, the next step e '= e+ 2(△ Y - △ x); If e < 0, the next step is e '= e+ 2 △ y, where e=2 △ xe'.
2.3 basic principle of improved midpoint drawing algorithm
F (x, y) = y-kx-b=0, where k = (y1-y0) / (x1-x0). (assuming 0 ≤ K ≤ 1, X is the maximum displacement direction). The current pixel is (xi, yi). The next pixel is Pd (right) or PU (top right). Let M=(xi+1, yi+0.5) be the midpoint of PU and Pd, and Q be the intersection of the ideal straight line and the x=xi+1 vertical line. Compare the Y coordinates of Q and m. When q is above M, Pu shall be the next pixel; Q is below m, Pd should be taken as the next point. The positional relationship between Q and M is determined by substituting the coordinates of point m into the linear equation, that is, by judging the coincidence of d= F(xm, ym)=F(xi+1, yi+0.5)=yi+0.5-k(xi+1)-b. When d < 0, M is below L(Q point), take Pu at the upper right as the next pixel; When d > 0, M is above L(Q point), take Pd on the right as the next pixel; When d=0, Pd or PU can be selected, and it is agreed to take Pd as the next pixel (Note: all points adopt the same rule). However, in this way, the calculation amount of each pixel includes addition, subtraction, multiplication, division and other calculations, which further increases the calculation amount. In order to improve the algorithm efficiency, the idea of incremental algorithm is also used to improve the algorithm. When d > = 0 is deduced, to determine the position of the next pixel, d = f (Xi + 2, y + 0.5) should be calculated =D-K; the increment is - K. when d < 0, to determine the next pixel position, calculate d=F(xi+2,y+1.5)=d+1+k. The increment is 1-k. the initial value D can be written as 0.5-k. the improvement is to replace d with 2d △ x, so that the calculation of D becomes D = △ x-2 △ y. The update of D is changed to d=d+2 △ x-2 △ y or d=d-2 △ y.
The above is only the case of 0 < = k < = 1. For - 1 < = k < = 0, you can deduce the initial d=-2 △ Y - △ x, and D is updated to d=d-2 △ x-2 △ y or d=d-2 △ y. for k > 1, you can deduce the initial d = - △ y+2 △ x, and D is updated to d=d+2 △ x-2 △ y or d=d+2 △ X. for K < - 1, you can deduce the initial d = - △ y-2 △ x, and D is updated to d=d-2 △ X or d=d-2 △ x-2 △ y.
When making a judgment based on k, we do not calculate the real k, but first set (x0, y0) to the point where x0 is always small, and define delta_x = x1 - x0; delta_y = y1 - y0; s=delta_x-abs(delta_y); according to the symbol of S and the symbol of delta_y, we can judge what kind of situation k belongs to.
3. Algorithm implementation process and results
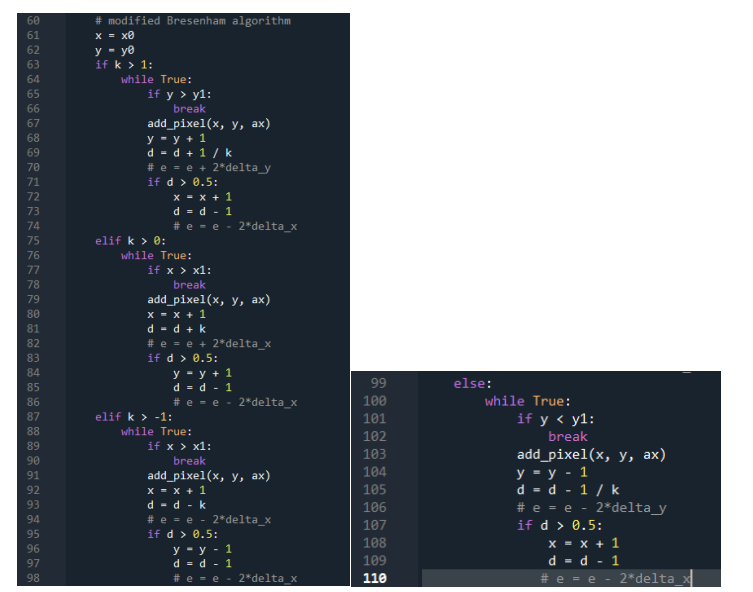
3.1DDA (numerical differential algorithm) implementation process
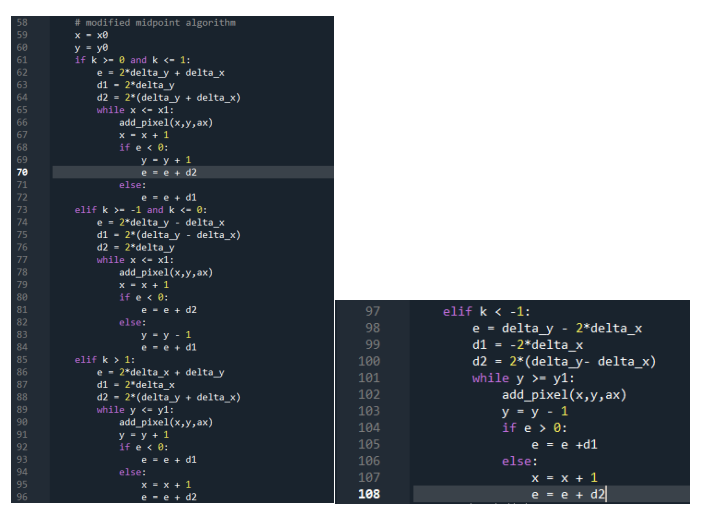
3.2 implementation process of improved Bresenham line drawing algorithm
3.3 implementation process of improved midpoint drawing algorithm
3.4 efficiency comparison of three algorithms
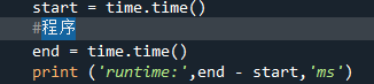
Python calculates time as follows
The results of the three algorithms and the corresponding execution time are as follows
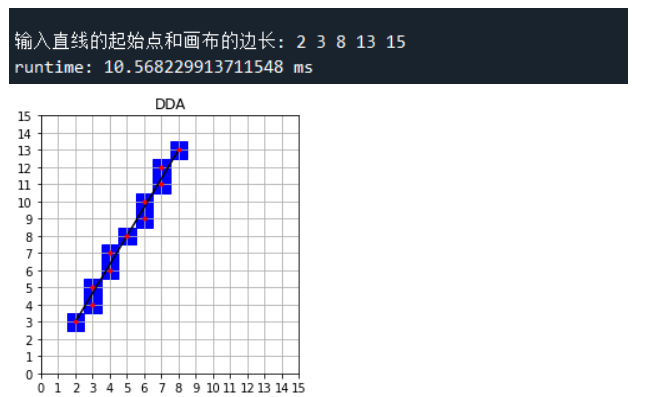
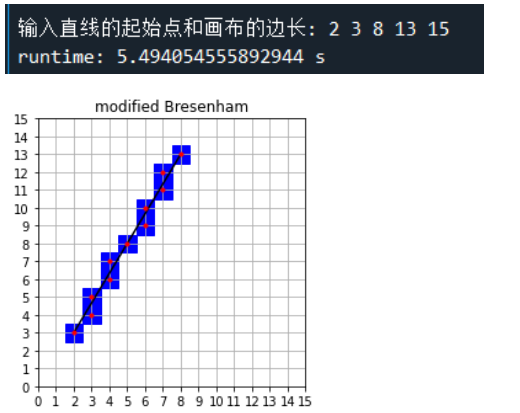
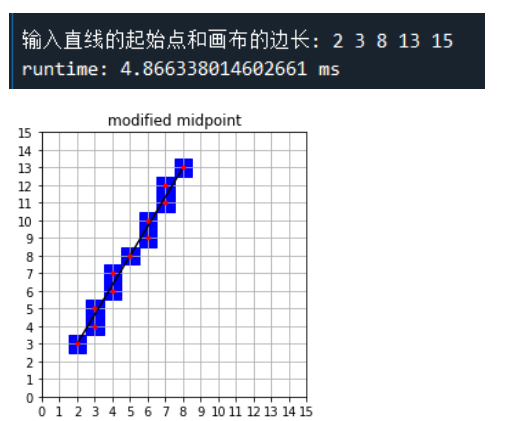
To sum up, it can be found that the efficiency of the three algorithms is modified midpoint > modified Bresenham > DDA
4. Experience
Through the implementation of three straight-line drawing algorithms with their own code, we have a further understanding of their algorithm principles, especially the usefulness of incremental algorithm in the process of programming. It can not only improve the efficiency of the algorithm, but also provide great convenience for programming. In the process of programming the algorithm, it is found that the calculation can often be reduced through some simple operations The complexity of the implementation of the method, such as the inversion operation.
In the experiment, at the beginning, due to his own negligence, he compared the unimproved Bresenham algorithm with DDA, and came to the conclusion that DDA is faster. This conclusion is obviously wrong, but the unimproved Bresenham algorithm will be much slower than DDA. After improvement, he got the correct conclusion.
This experiment gave me a deeper understanding of the function time() in Python, which calculates time. Its unit is ms, and it is the result of 100 times of execution of the function. At first, I thought it was s, and I was still wondering why the execution time was so long. Later, I found it by consulting relevant materials on the Internet. The unit is ms, which impressed me deeply.
s. And it was the result of the function executed 100 times. At first, I thought it was s and wondered why the execution time was so long. Later, I found that the unit was ms through consulting relevant information on the Internet, which impressed me deeply.
In short, this experimental class has gained a lot. I not only learned the implementation of three straight line drawing algorithms, but also cultivated my spirit of integrating theory with practice. Finally, I thank the teacher for answering my questions and other students who have solved my problems.
code
1.DDA
# -*- coding: utf-8 -*-
"""
Created on Sat Oct 24 18:28:30 2020

@author: Little genius
"""
import time
from pylab import subplot,show
from matplotlib.ticker import MultipleLocator
import matplotlib.patches as patches

# Initialize layout
def init(ax, width):
    # Set length and width
    ax.axis([0, width, 0, width])
    # Set axis scale value
    majorLocator = MultipleLocator(1)
    ax.xaxis.set_major_locator(majorLocator)
    ax.yaxis.set_major_locator(majorLocator)
    # display grid lines
    ax.grid(True)

# Add pixel
def add_pixel(x, y, ax):
    # x. y rounded
    x = round(x)
    y = round(y)
    # Blue frame logo
    ax.add_patch(patches.Rectangle((x - 0.5, y - 0.5), 1, 1, color='b'))
    ax.plot(x, y, 'r.')

# main program
if __name__ == '__main__':
    # The program starts running
    start = time.time()
    # Splits a line of strings and converts them to numbers
    x0, y0, x1, y1, width = map(int, input("Enter the starting point of the line and the side length of the canvas: ").split(' '))
    # Guarantee from small to large
    if x0 > x1 :
        x0 , x1 = x1 , x0
        y0 , y1 = y1 , y0
    # Equal scale, title
    ax = subplot(aspect='equal', title='DDA')
    ax.plot([x0, x1], [y0, y1], '-k')
    # Graphics initialization
    init(ax, width)
    delta_x = x1 - x0
    delta_y = y1 - y0
    # k infinity
    if delta_x == 0:
        k = 999999999
    else:
        k = delta_y / delta_x
    x = round(x0)
    y = round(y0)

    # DDA algorithm
    if k > -1 and k < 1:
        # X maximum displacement
        while True:
            if x > x1:
                break
            add_pixel(x, y, ax)
            x = x+1
            y = y+k
    elif k >= 1:
        # Y maximum displacement
        while True:
            if y > y1:
                break
            add_pixel(x, y, ax)
            y = y+1
            x = x+1/k
    else:
        while True:
            if y < y1:
                break
            add_pixel(x, y, ax)
            y = y-1
            x = x-1/k
    #End of program operation
    show()
    end = time.time()
    print ('runtime:',end - start,'ms')
2. Improve Bresenham
# -*- coding: utf-8 -*-
"""
Created on Sat Oct 24 19:37:29 2020

@author: Little genius
"""

import time
from pylab import subplot,show
from matplotlib.ticker import MultipleLocator
import matplotlib.patches as patches

# Initialize layout
def init(ax, width):
    # Set length and width
    ax.axis([0, width, 0, width])
    # Set axis scale value
    majorLocator = MultipleLocator(1)
    ax.xaxis.set_major_locator(majorLocator)
    ax.yaxis.set_major_locator(majorLocator)
    # display grid lines
    ax.grid(True)

# Add pixel
def add_pixel(x, y, ax):
    # x. y rounded
    x = round(x)
    y = round(y)
    # Blue frame logo
    ax.add_patch(patches.Rectangle((x - 0.5, y - 0.5), 1, 1, color='b'))
    ax.plot(x, y, 'r.')

# main program
if __name__ == '__main__':
    # The program starts running
    start = time.time()
    # Splits a line of strings and converts them to numbers
    x0, y0, x1, y1, width = map(int, input("Enter the starting point of the line and the side length of the canvas: ").split(' '))
    # Guarantee from small to large
    if x0 > x1 :
        x0 , x1 = x1 , x0
        y0 , y1 = y1 , y0
    # Equal scale, title
    ax = subplot(aspect='equal', title='modified Bresenham')
    ax.plot([x0, x1], [y0, y1], '-k')
    # Graphics initialization
    init(ax, width)
    delta_x = x1 - x0
    delta_y = y1 - y0
    d = 0
    # e = - delta_x
    # k infinity
    if delta_x == 0:
        k = 999999999
    else:
        k = delta_y / delta_x
    x = round(x0)
    y = round(y0)

    # modified Bresenham algorithm
    x = x0
    y = y0
    if k > 1:
        while True:
            if y > y1:
                break
            add_pixel(x, y, ax)
            y = y + 1
            d = d + 1 / k
            # e = e + 2*delta_y
            if d > 0.5:
                x = x + 1
                d = d - 1
                # e = e - 2*delta_x
    elif k > 0:
        while True:
            if x > x1:
                break
            add_pixel(x, y, ax)
            x = x + 1
            d = d + k
            # e = e + 2*delta_x
            if d > 0.5:
                y = y + 1
                d = d - 1
                # e = e - 2*delta_x
    elif k > -1:
        while True:
            if x > x1:
                break
            add_pixel(x, y, ax)
            x = x + 1
            d = d - k
            # e = e - 2*delta_x
            if d > 0.5:
                y = y - 1
                d = d - 1
                # e = e - 2*delta_x
    else:
        while True:
            if y < y1:
                break
            add_pixel(x, y, ax)
            y = y - 1
            d = d - 1 / k
            # e = e - 2*delta_y
            if d > 0.5:
                x = x + 1
                d = d - 1
               # e = e - 2*delta_x
    #End of program operation
    show()
    end = time.time()
    print ('runtime:',end - start,'s')
3. Improve midpoint drawing
# -*- coding: utf-8 -*-
"""
Created on Sat Oct 24 20:54:13 2020

@author: Little genius
"""

import time
from pylab import subplot,show
from matplotlib.ticker import MultipleLocator
import matplotlib.patches as patches

# Initialize layout
def init(ax, width):
    # Set length and width
    ax.axis([0, width, 0, width])
    # Set axis scale value
    majorLocator = MultipleLocator(1)
    ax.xaxis.set_major_locator(majorLocator)
    ax.yaxis.set_major_locator(majorLocator)
    # display grid lines
    ax.grid(True)

# Add pixel
def add_pixel(x, y, ax):
    # x. y rounded
    x = round(x)
    y = round(y)
    # Blue frame logo
    ax.add_patch(patches.Rectangle((x - 0.5, y - 0.5), 1, 1, color='b'))
    ax.plot(x, y, 'r.')

# main program
if __name__ == '__main__':
    # The program starts running
    start = time.time()
    # Splits a line of strings and converts them to numbers
    x0, y0, x1, y1, width = map(int, input("Enter the starting point of the line and the side length of the canvas: ").split(' '))
    # Guarantee from small to large
    if x0 > x1 :
        x0 , x1 = x1 , x0
        y0 , y1 = y1 , y0
    # Equal scale, title
    ax = subplot(aspect='equal', title='modified midpoint')
    ax.plot([x0, x1], [y0, y1], '-k')
    # Graphics initialization
    init(ax, width)
    delta_x = x1 - x0
    delta_y = y1 - y0
    # k infinity
    if delta_x == 0:
        k = 999999999
    else:
        k = delta_y / delta_x
    x = round(x0)
    y = round(y0)

    # modified midpoint algorithm
    x = x0
    y = y0
    if k >= 0 and k <= 1:
        e = 2*delta_y + delta_x
        d1 = 2*delta_y
        d2 = 2*(delta_y + delta_x)
        while x <= x1:
            add_pixel(x,y,ax)
            x = x + 1
            if e < 0:
                y = y + 1
                e = e + d2
            else:
                e = e + d1
    elif k >= -1 and k <= 0:
        e = 2*delta_y - delta_x
        d1 = 2*(delta_y - delta_x)
        d2 = 2*delta_y
        while x <= x1:
            add_pixel(x,y,ax)
            x = x + 1
            if e < 0:
                e = e + d2
            else:
                y = y - 1
                e = e + d1
    elif k > 1:
        e = 2*delta_x + delta_y
        d1 = 2*delta_x
        d2 = 2*(delta_y + delta_x)
        while y <= y1:
            add_pixel(x,y,ax)
            y = y + 1
            if e < 0:
                e = e + d1
            else:
                x = x + 1
                e = e + d2
    elif k < -1:
        e = delta_y - 2*delta_x
        d1 = -2*delta_x
        d2 = 2*(delta_y- delta_x)
        while y >= y1:
            add_pixel(x,y,ax)
            y = y - 1
            if e > 0:
                e = e +d1
            else:
                x = x + 1
                e = e + d2
    #End of program operation
    show()
    end = time.time()
    print ('runtime:',end - start,'ms')