How to use GDAL/OGR to open the vector and output the layer data range and each employee feature range
The main purpose of this paper is: sometimes we need to get the external rectangle range of vector data, but a layer data has several surface elements, if we get the overall external rectangle for processing, it will cause a large amount of data; then we judge the external rectangle one by one; then we generate point data according to the external rectangle range.
1) How to use GDAL/OGR to open the vector and output the layer data range and each employee feature range
2) Generate point data according to the rectangle range and pixel size
0. Conception
Source:
Data form, there is a face layer data,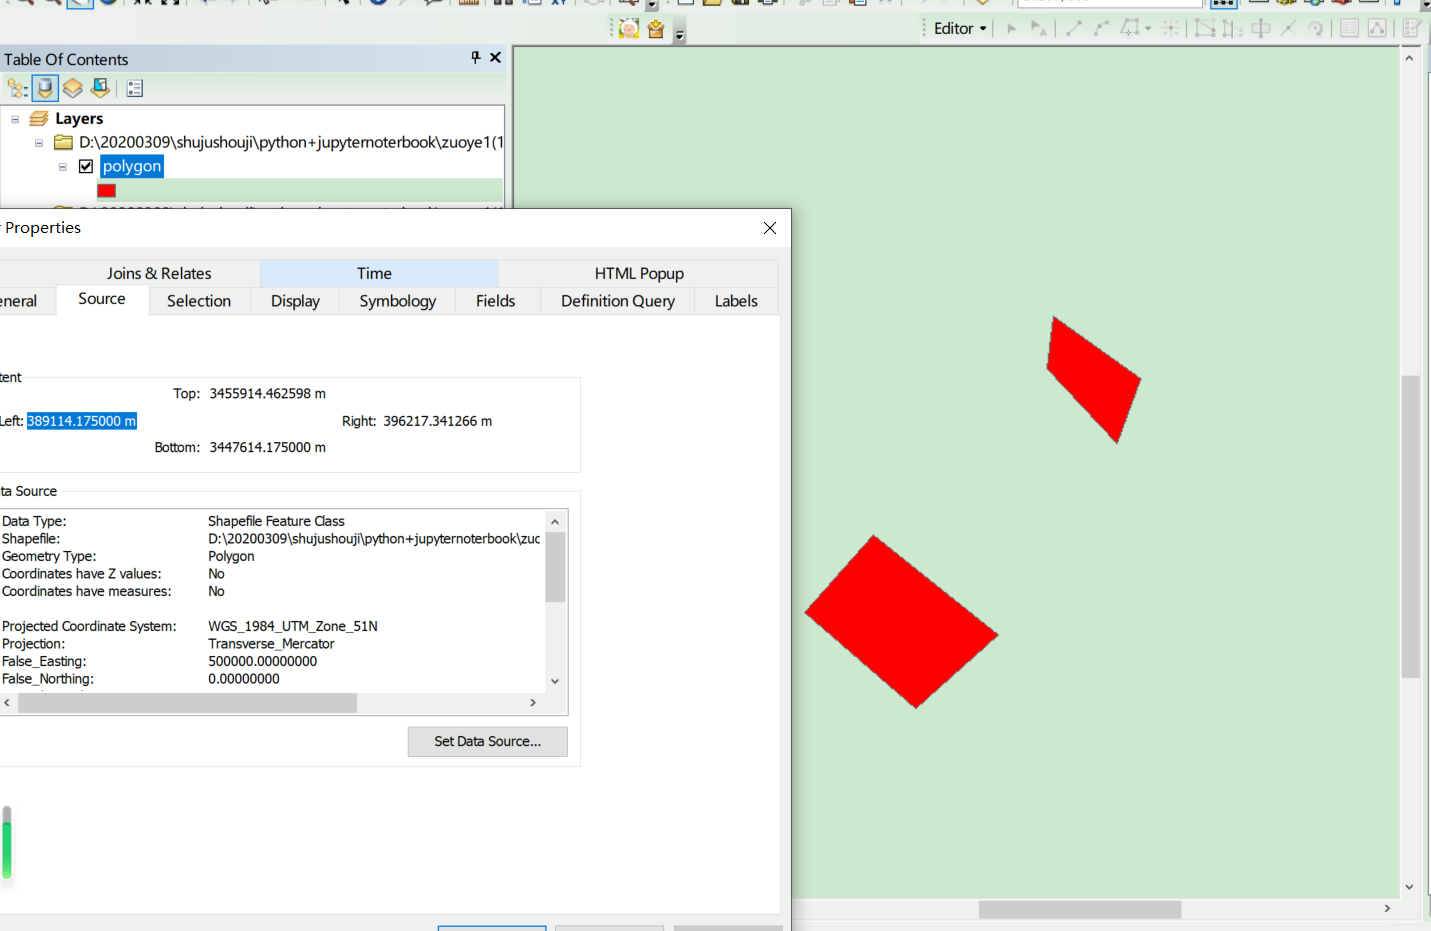
One grid data: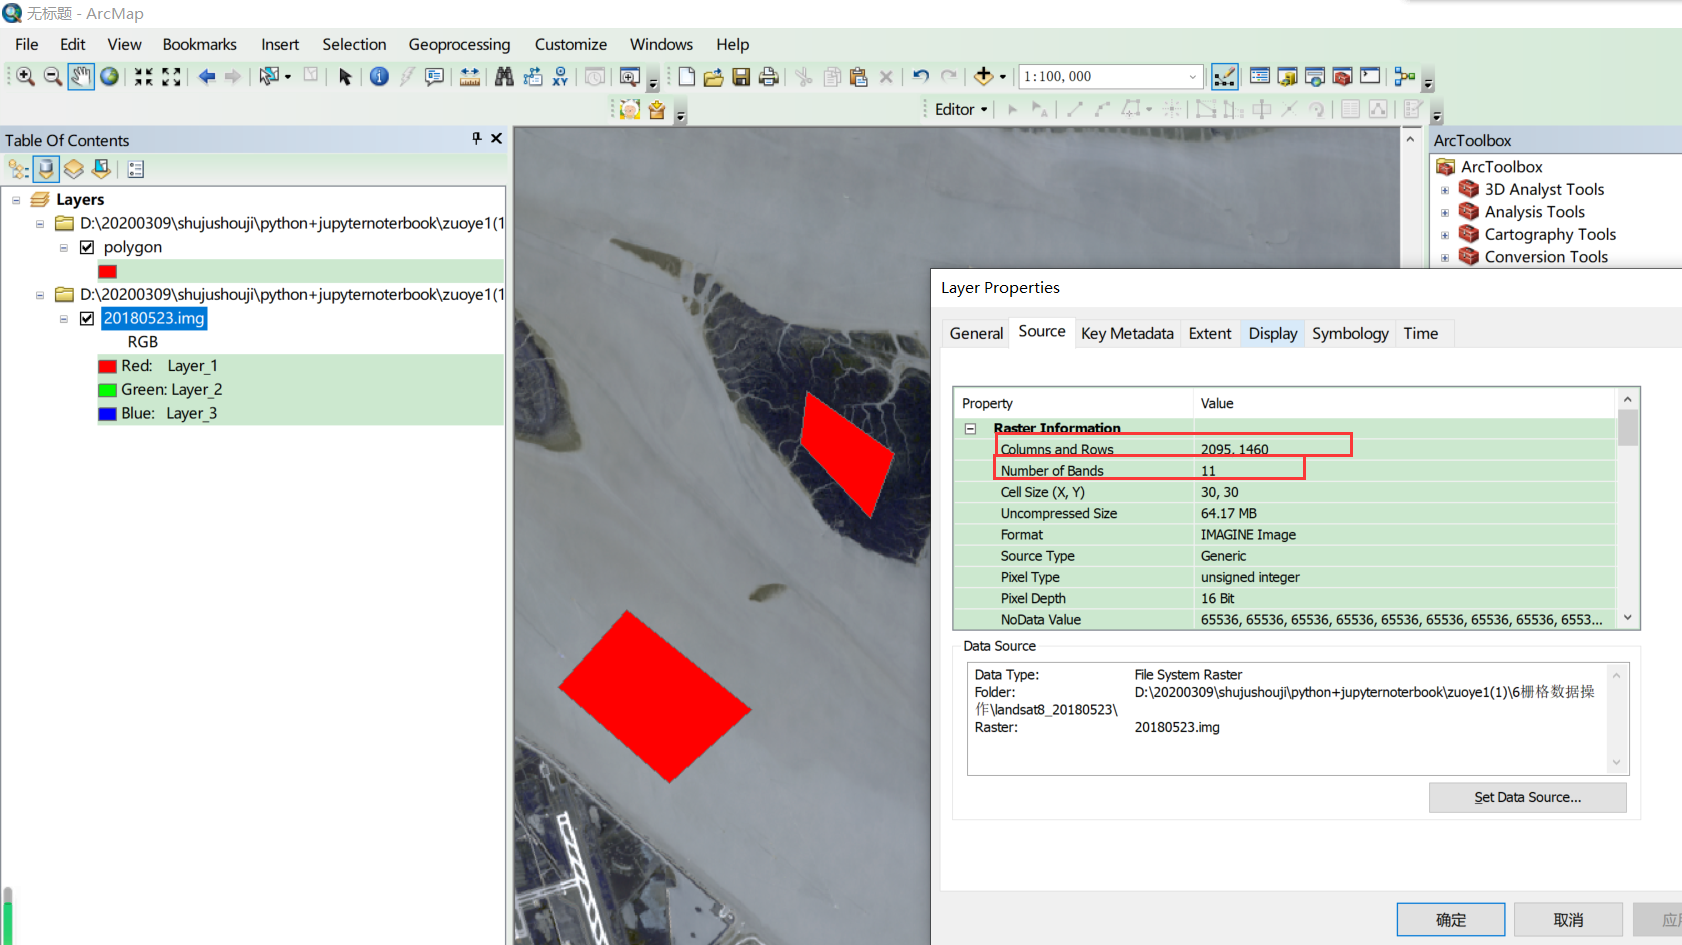
I need to extract the point data in each face layer from the vector face data. The interval size of the point data is the pixel size of the grid data, that is, the figure above. The point data to be extracted is:
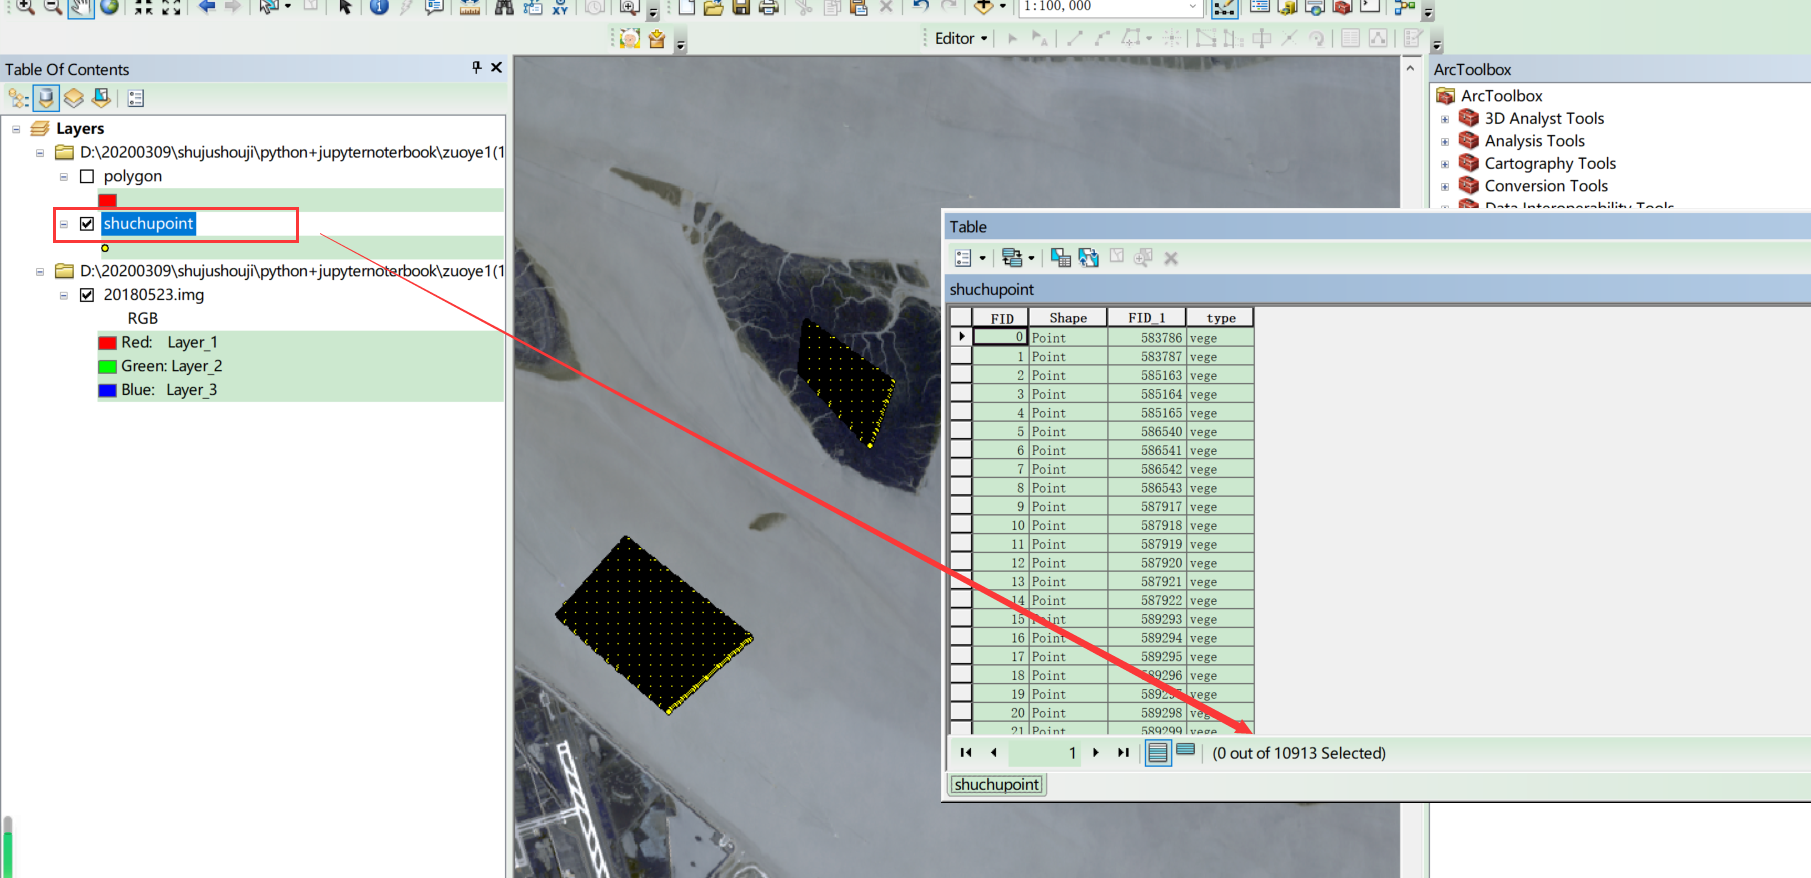
Zoom in to see this kind of point data: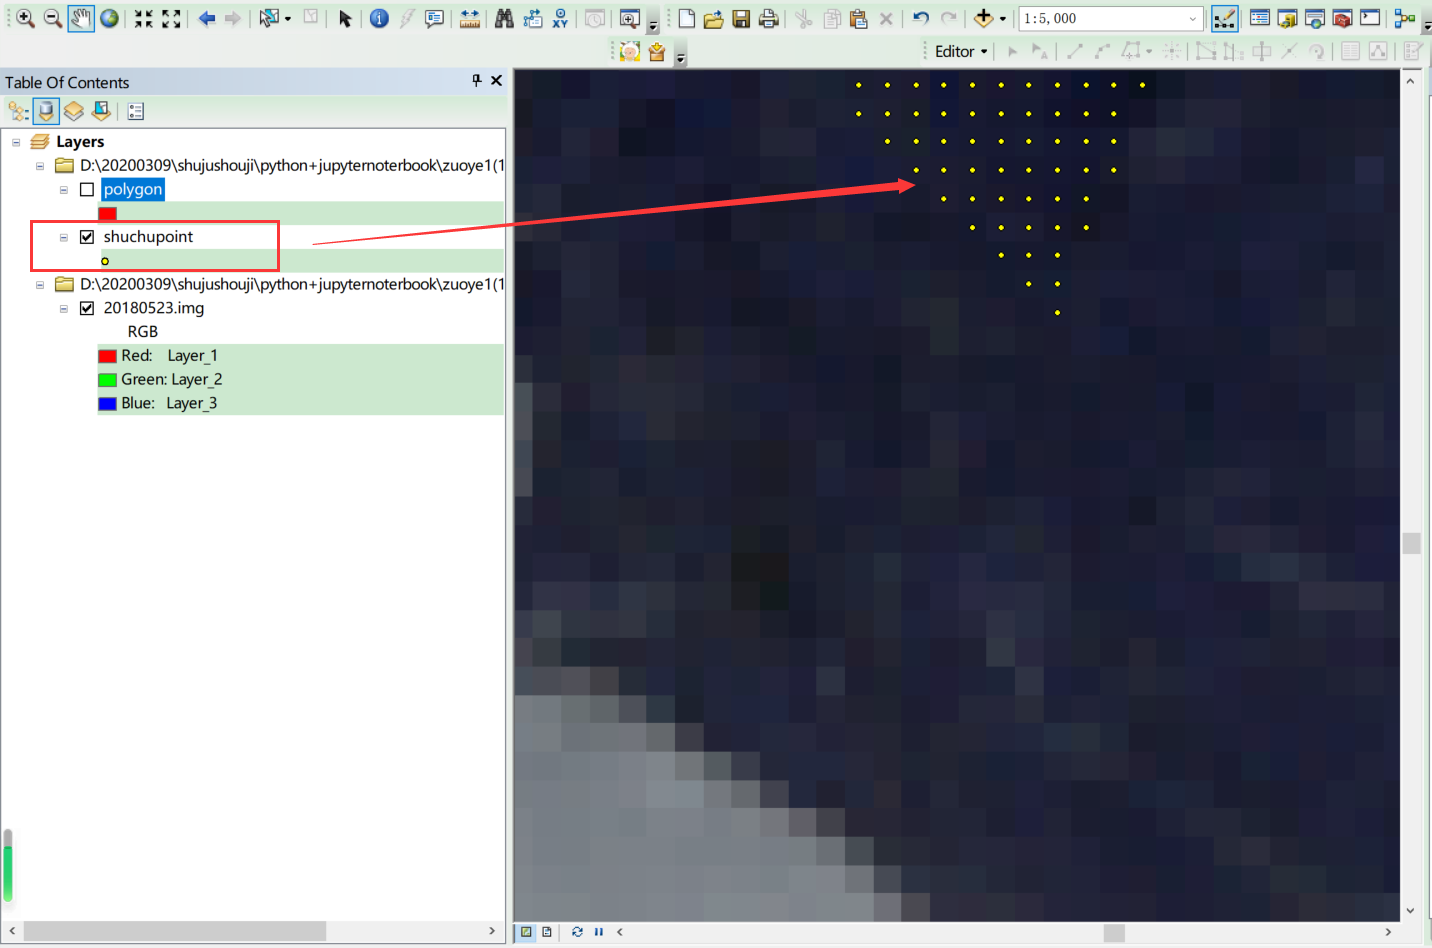
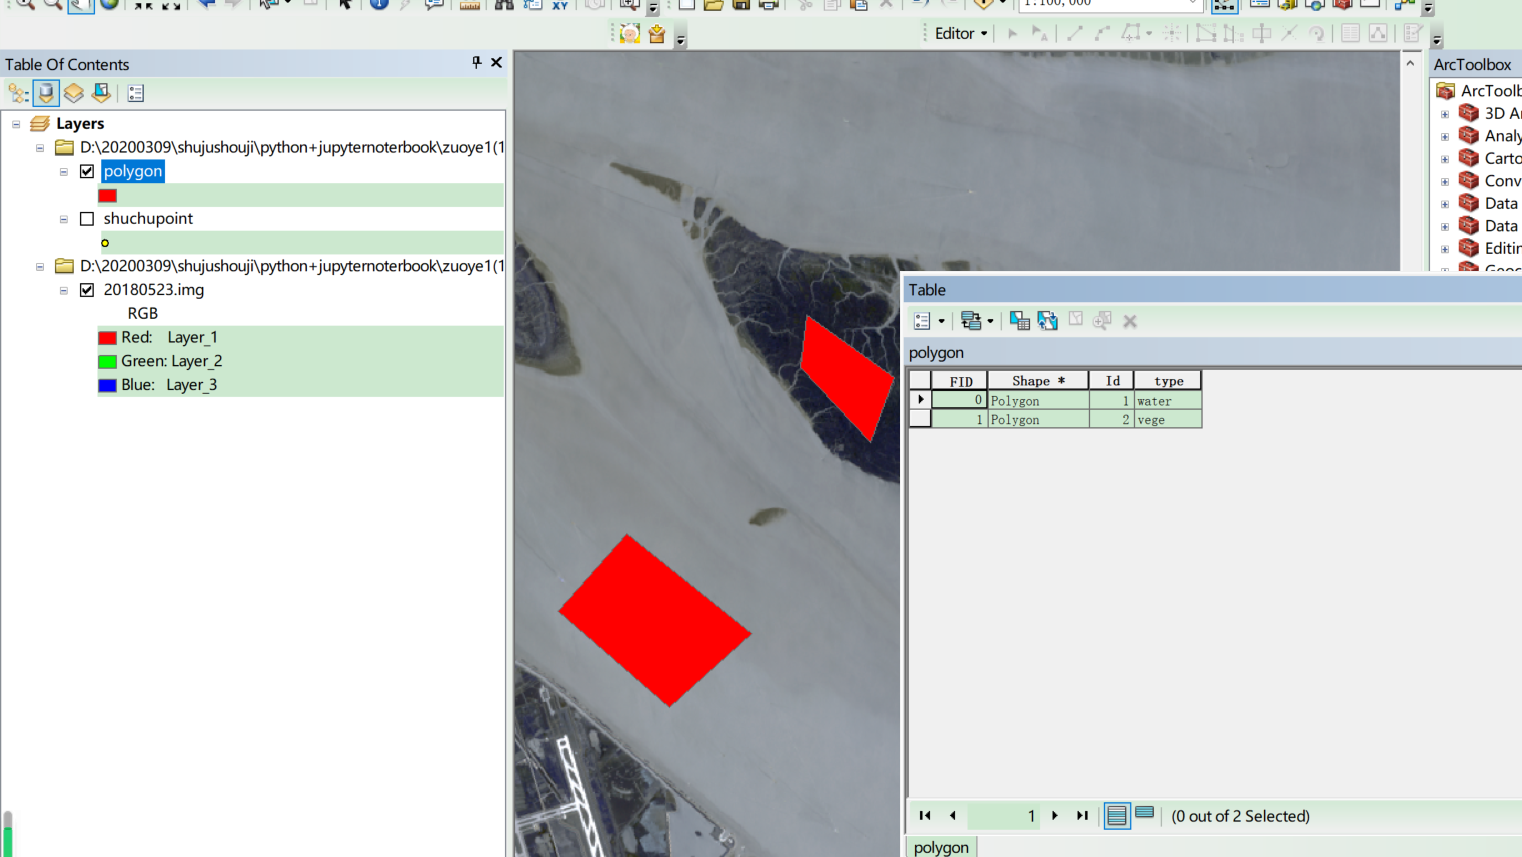
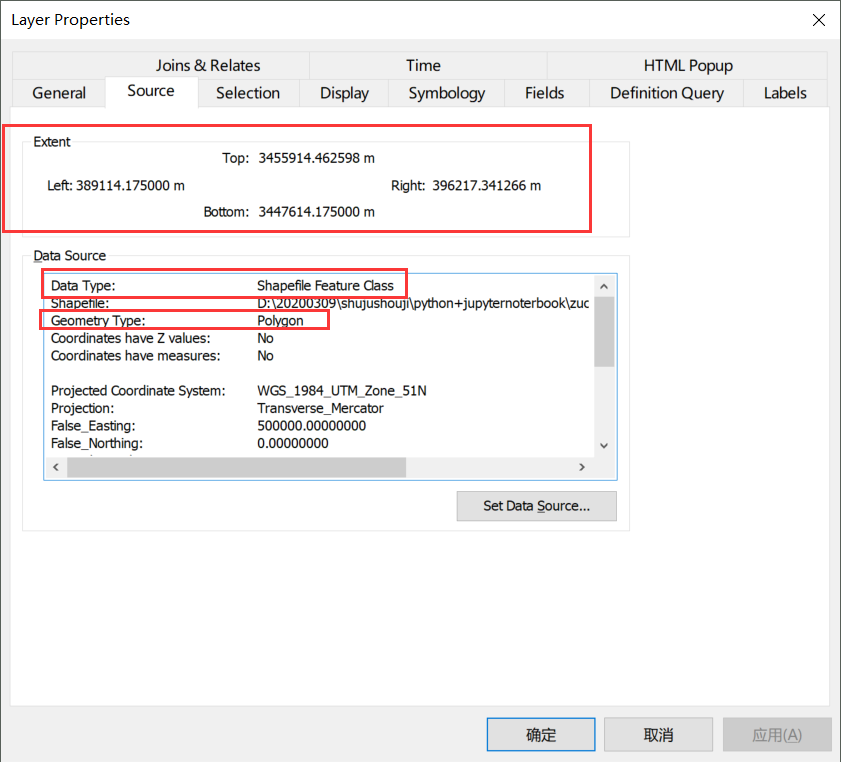
1. arcmap view data attribute information
First, open my data with arcmap, and view the range and attribute information of the data:
2. Output the extent of the extent bounding rectangle for each data
Getextend() function is used to get the layer data range;
To get the range of elements, you need to cycle each element, and then use the GetEnvelope() function;
#How to use GDAL/OGR to open the vector file, read the property sheet fields, and change the data range and the range of each employee feature
import ogr,sys,os
import numpy as np

os.chdir('D:/20200309/shujushouji/python+jupyternoterbook/zuoye1(1)/6 Grid data operation/shiyan')

#Set up the driver and open the vector file
driver = ogr.GetDriverByName('ESRI Shapefile')
ds = driver.Open('polygon.shp', 0)
if ds is None:
  print("Could not open", 'sites.shp')
  sys.exit(1)
#Get Atlas
layer = ds.GetLayer()

#Number of elements
numFeatures = layer.GetFeatureCount()
print("Feature count: "+str(numFeatures))

#Scope of acquisition
extent = layer.GetExtent()
print("Extent:", extent)
print("UL:", extent[0],extent[3])
print("LR:", extent[1],extent[2])

#Get elements
#feature = layer.GetNextFeature()

#Loop each element attribute
for i in range(numFeatures):
  feature = layer.GetNextFeature()
  #Get properties of field 'id'
  id = feature.GetField('type')
  #Get space properties
  print(id)
  geometry = feature.GetGeometryRef()
  #x = geometry.GetX()
  polygonextent=geometry.GetEnvelope()
  print(geometry.GetEnvelope())
  #print(y)

  #y = geometry.GetY()
  print("UL:", polygonextent[0],polygonextent[3])
  print("LR:", polygonextent[1],polygonextent[2])
3. Generate point data according to the outer rectangular range
The following code is generated by sampling and generating point s according to the external rectangle of polygon's ext;
It involves the knowledge that gdal reads the grid data, obtains the starting coordinates and pixel sizes of the upper left corner of the image, and the spatial coordinates of the external rectangular range obtained by finding vectors, converts the spatial coordinates into the row and column numbers of the image, and then circularly generates the vector point data, and writes it into the vector file.
# Get it first polygon.shp The range of the outer rectangle and the coordinate point; then convert the coordinate point to the row and column number of the grid, only for sample_ The grid area within the region is used to turn the grid to point
%matplotlib inline
import matplotlib.pyplot as plt
from shapely.geometry import Point
import geopandas as gpd
import ogr,sys,os
from pyproj import Transformer
import numpy as np
from osgeo import gdal

os.chdir('D:/20200309/shujushouji/python+jupyternoterbook/zuoye1(1)/shiyan/polygon')


#Set up the driver and open the vector file
driver = ogr.GetDriverByName('ESRI Shapefile')
dsshp = driver.Open('sample_regions.shp', 0)
if dsshp is None:
  print("Could not open", 'sites.shp')
  sys.exit(1)
#Get Atlas
layer = dsshp.GetLayer()

#Number of elements
numFeatures = layer.GetFeatureCount()
print("Feature count: "+str(numFeatures))

def world2Pixel(geotransform, x, y):
    originX = geotransform[0]
    originY = geotransform[3]
    pixelWidth = geotransform[1]
    pixelHeight = geotransform[5]
    line = int((y-originY)/pixelHeight)+1
    column = int((x-originX)/pixelWidth)+1
    return (line,column)
def Pixel2world(geotransform, line, column):
    originX = geotransform[0]
    originY = geotransform[3]
    pixelWidth = geotransform[1]
    pixelHeight = geotransform[5]
    x = column*pixelWidth + originX - pixelWidth/2
    y = line*pixelHeight + originY - pixelHeight/2
    return(x,y)

ds = gdal.Open( "D:/20200309/shujushouji/python+jupyternoterbook/zuoye1(1)/6 Grid data operation/landsat8_20180523/20180523.img" )

geotransform = ds.GetGeoTransform()


# Get spatial coordinate range
extent = layer.GetExtent()
print("Extent:", extent)
print("UL:", extent[0],extent[3])
print("LR:", extent[1],extent[2])

# Research area will be acquired polygon.shp The number of rows and columns converted into grid data
linex1,columny1 = world2Pixel(geotransform, extent[0],extent[3])
print(f"linex1:{linex1}")
print(f"columny1:{columny1}")

linex2,columny2 = world2Pixel(geotransform,extent[1],extent[2])
print(f"linex2:{linex2}")
print(f"columny2:{columny2}")


points = []
for i in range(linex1,linex2):
    for j in range(columny1,columny2):
        x,y = Pixel2world(geotransform,i+1,j+1)
        point = Point((x,y))
        points.append(point)
gdf = gpd.GeoDataFrame()
gdf["geometry"] = points

#Assign the coordinate system of grid data to the point data of the region of interest
print(ds.GetProjection())
gdf.crs=ds.GetProjection()
gdf.to_file("D:/20200309/shujushouji/python+jupyternoterbook/zuoye1(1)/6 Grid data operation/test/d_points1.shp")
gdf.plot()