I know there is a problem: after the epidemic, what is the most thing you want to do?
Many people study python and don't know where to start.
Many people learn python, master the basic syntax, do not know where to find cases to start.
Many people who have already done cases do not know how to learn more advanced knowledge.
Then for these three types of people, I will provide you with a good learning platform, free access to video tutorials, e-books, and the source code of the course!
QQ group: 1097524789
Some people replied that the person they wanted to see most was the owner of the barbecue downstairs. The thing they wanted to do most was to have a bunch of beer, dozens of strings, eat slowly and leisurely by themselves, and then watch the people around chatting noisily.
An epidemic, finally many people understand: the original shaking of the red wine cup, not all of life. The light smoke and fire is the essence of life.
Recently, the street economy with smoke and fire is on fire.
All this stems from an attempt by Chengdu: in March, Chengdu issued a policy to allow merchants to temporarily occupy roads in a specified area. For a while, barbecue stalls, clothing stalls, small commodity stalls have been placed on the roadside.
Two months later, data released in Chengdu showed that 100000 jobs had been solved, helping the return rate of restaurants in the central urban area exceed 98%. Chengdu's GDP, which fell 3% year on year in the first quarter, suddenly regained its vitality.
When the flow of people comes back, the vitality of the city comes back.
All of a sudden, the stall economy has become people's talk after dinner, many people have begun to plan what to sell stall. Once the city management didn't let the stall. Today's city management calls you to stall. Is the era of stall economy really coming? Today we'll take you to a data disk.

1. Microblog micro hotspot data
Let's first see the data of microblog micro hotspot:
Source: http://www.wrd.cn/goSearch.sht
Trend of heat index of the whole network
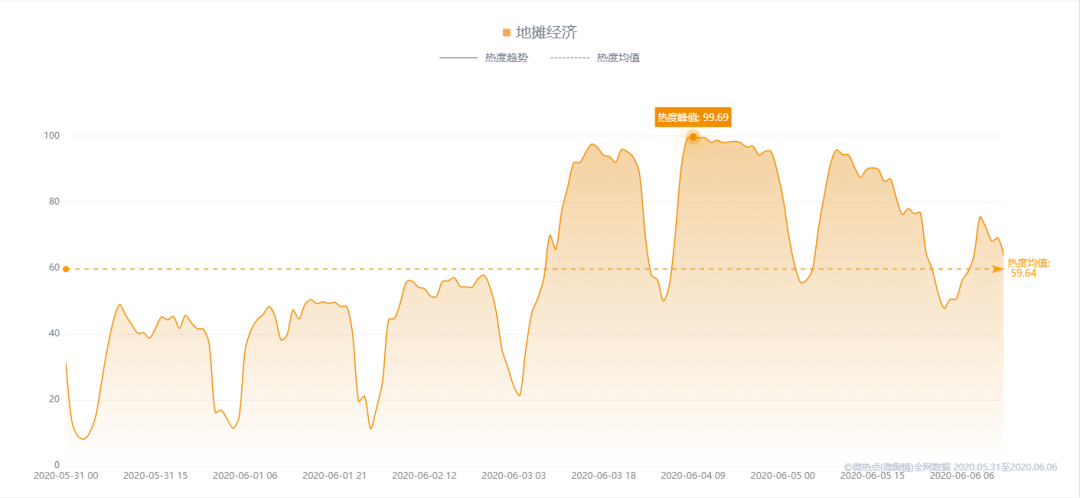
From the change trend of the heat index of the whole network, the heat of the local stall economy gradually increased since June 3, and reached the peak of 99.69 at 9:00 on June 4.
Cloud map of keywords in the whole network

See the keyword cloud chart of the whole network again. In all the information related to the local stall economy, the words mentioned most frequently are "local stall economy", "stall setting" and "all staff".
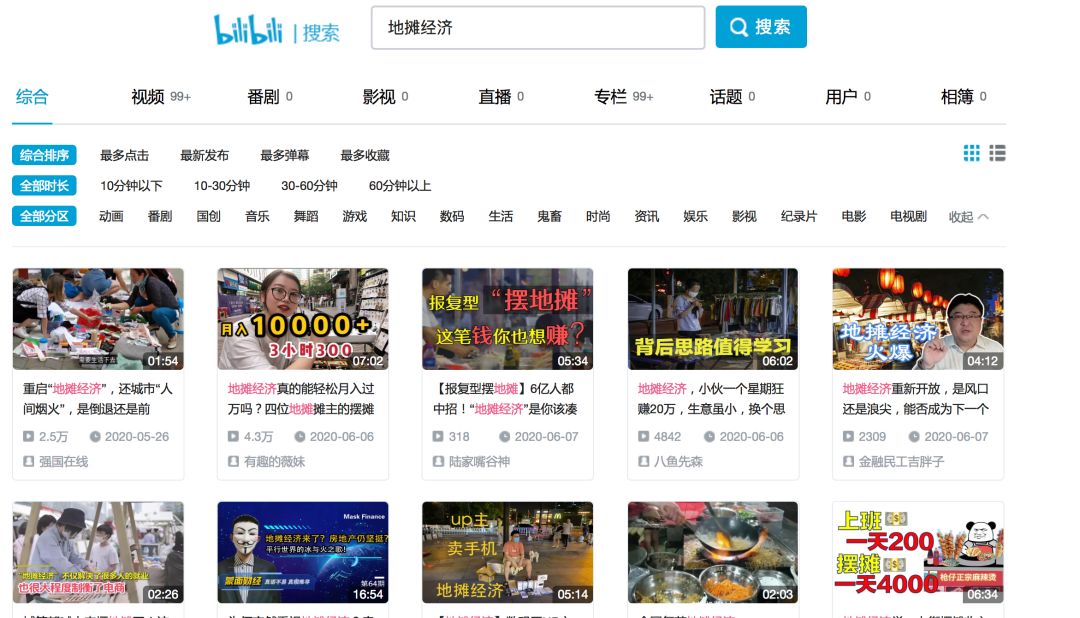
2. Video barrage data of station B
At present, there are many videos about the local stall economy in station B.
We saw this video about Chengdu's stall economy and culture. At present, the video has played 141000 videos on station B, with 3856 bullet screens.
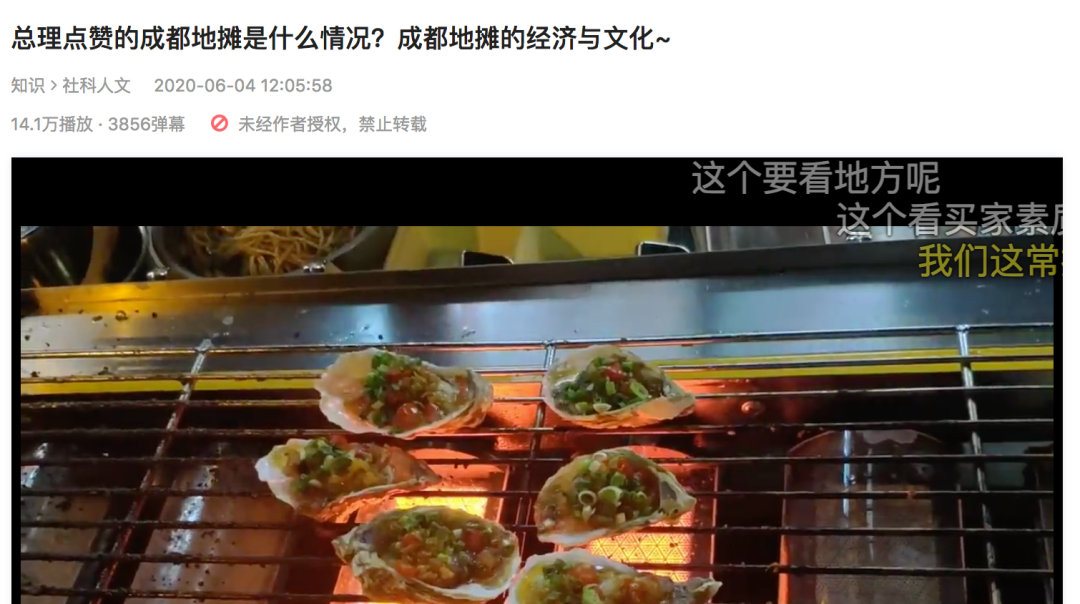
Address:
https://www.bilibili.com/video/BV1Ft4y1y7iG?from=search&seid=12113765873623399312
So what are you talking about in these barrages? We analyze and sort out these barrages, so that we can see the cloud map of words.
Cloud picture of bullet screen words

It can be seen that the most discussed content is not only "local stall" and "Chengdu", but also "health", "urban management" and "profit". Among them, "delicious food", "snacks", "barbecue" and "clean" are also issues of great concern.
Whether to support the balloting of local stall economy
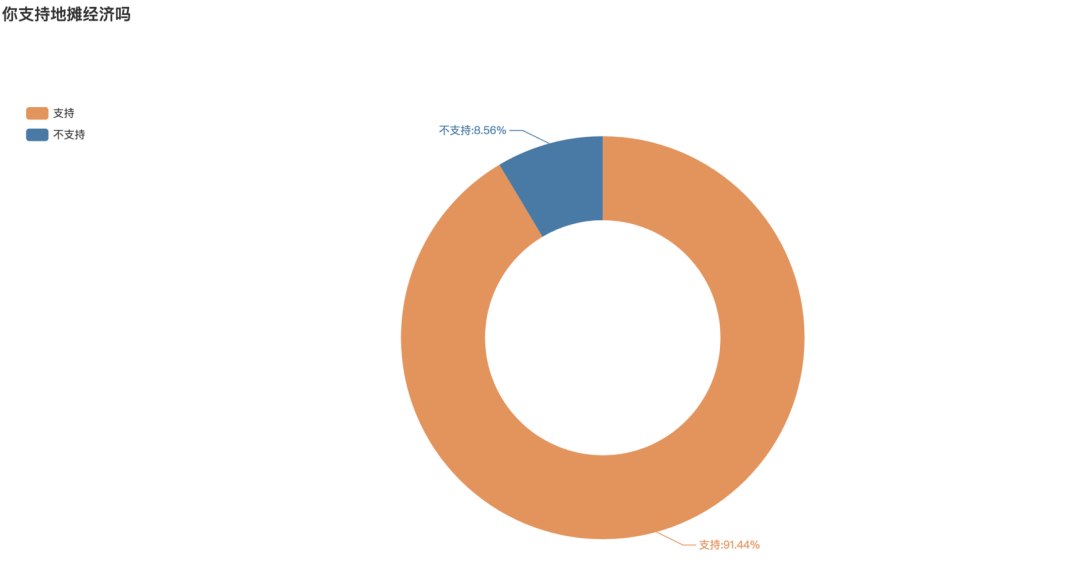
At the end of the video, it also launched a balloting on whether you support the local economy. The number of balloting supported is 1, and the number of balloting not supported is 2. According to statistics, there are 1869 balloting, 91.44% of which support the balloting, and only 8.56% do not support the balloting
3. Weibo comment topic data
Let's see the microblog with the highest voice for discussion on the stall economy.
First of all, I saw the topic of Weibo: would you consider setting up a stall
We analyzed 3436 comments:

It can be seen that when we consider whether to set up a stall, the most important thing we think about is the issue of "urban management". The former urban management didn't let it. Today's urban management asks you to set up a stall. I'll see you for a long time. Secondly, "economy", "turnover", "income" and so on are also the focus of special concern.
Here is the topic of "what would you sell if you set up a stall". At present, there are 4.086 million readings and 3934 discussions on this topic, and we get 3657 data after de duplication.

Comment cloud

Through the analysis of word cloud, we can find that "film" is a stall project that many people want to try. Secondly, "barbecue", "cold noodles", "pancakes and fruits" and other street food are the choices of many people. In addition to eating, "flower", "jewelry", "socks" and other products are also many people want to try. Interestingly, fortune telling has been mentioned many times.
See what your professional stall can do. We have 1641 discussion data.

This is more interesting:
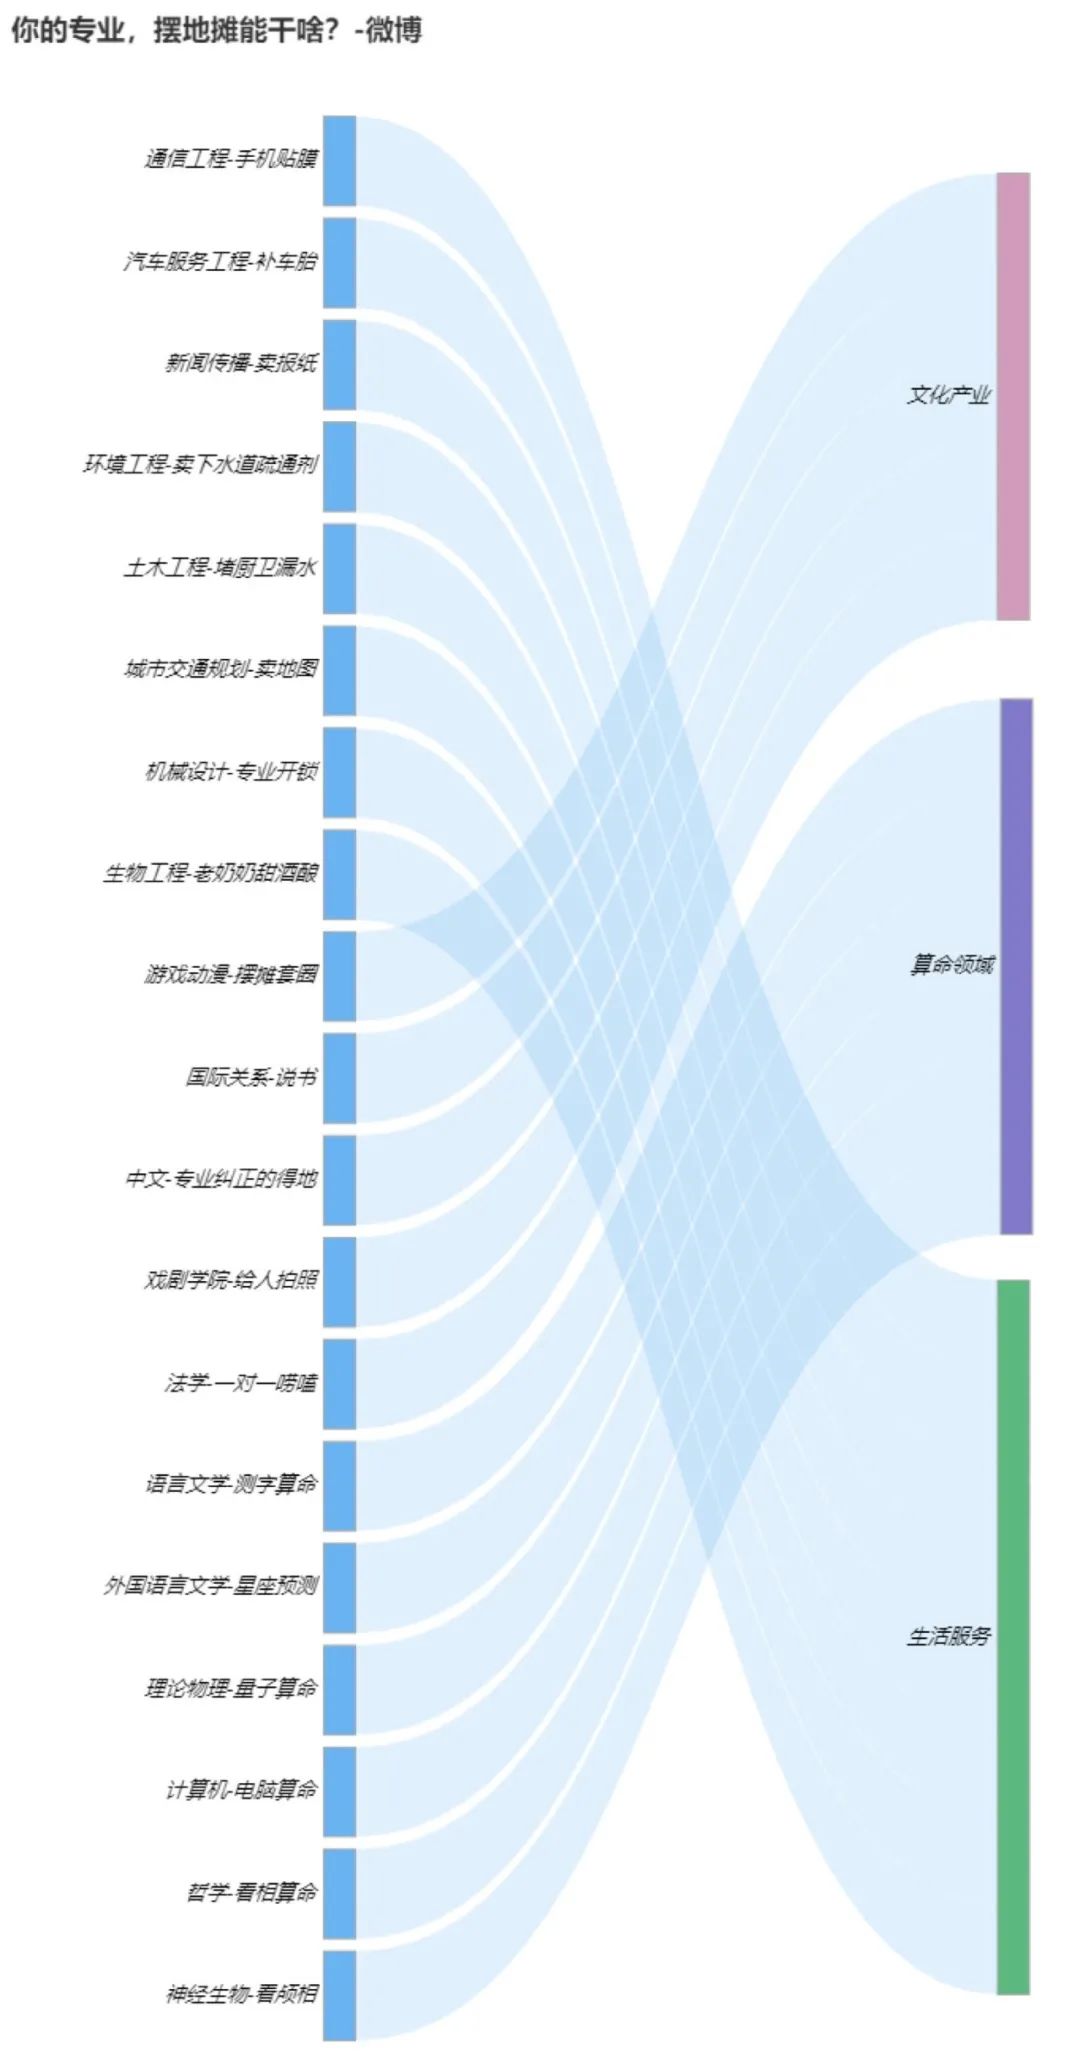
We can see that for example, the small partners of Journalism and communication major choose to sell newspapers, the mechanical major chooses to lock the lock, the philosophy major chooses to look at the picture and fortune telling and other magic operations.
Who are all involved in the discussion of the topic of local stall? We analyzed the microblog users who participated in the topic and obtained 4875 pieces of data.
Gender proportion of microblog comment users
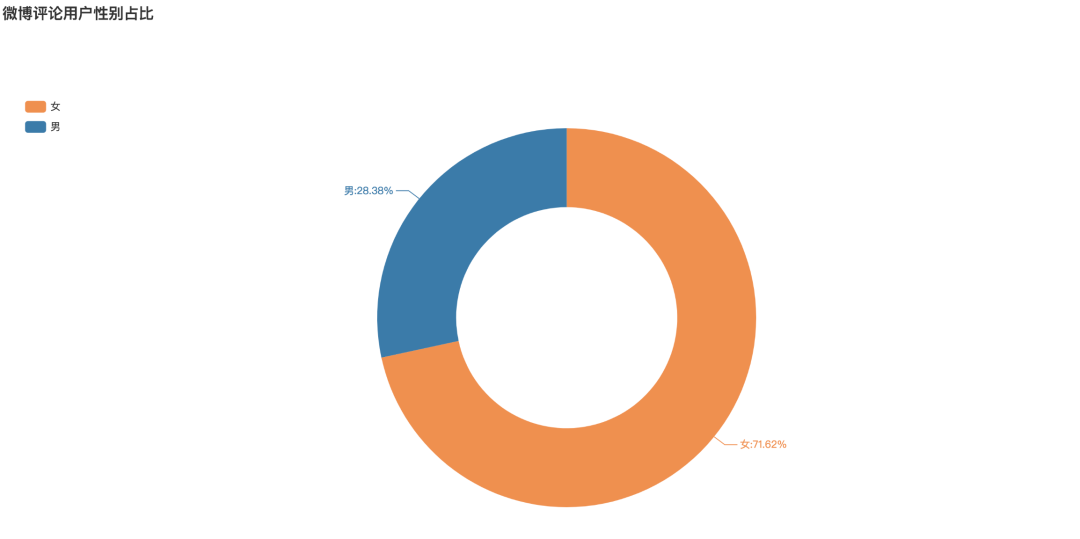
It can be seen that among the users participating in the topic, the proportion of female users is 71.62%, while that of male users is only 28.38%. In the topic of land sharing economy, the participation rate of female users is far higher than that of male users.
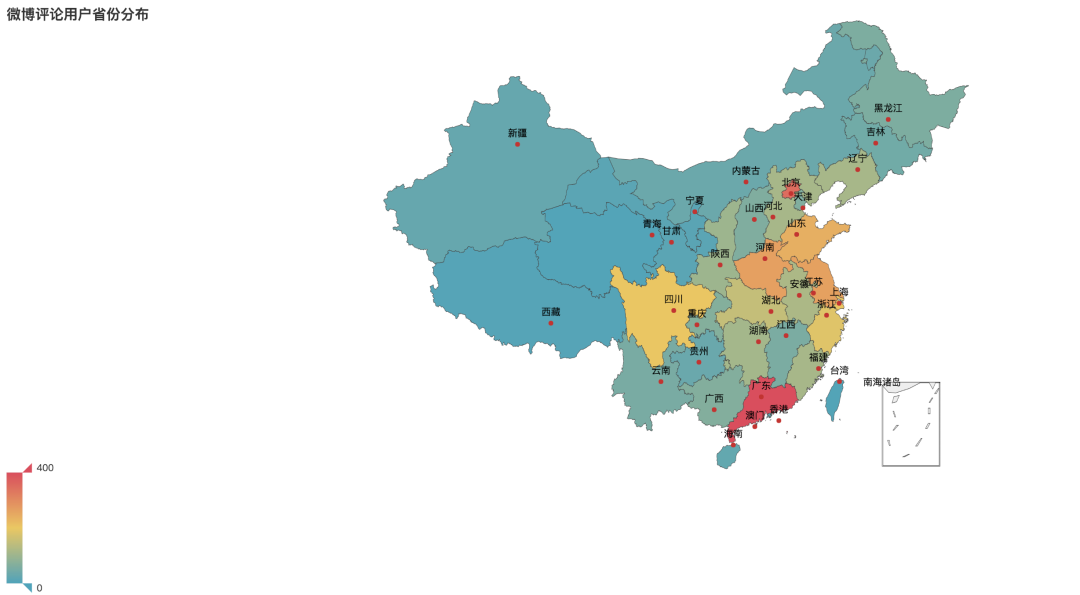
Regional distribution of comment users
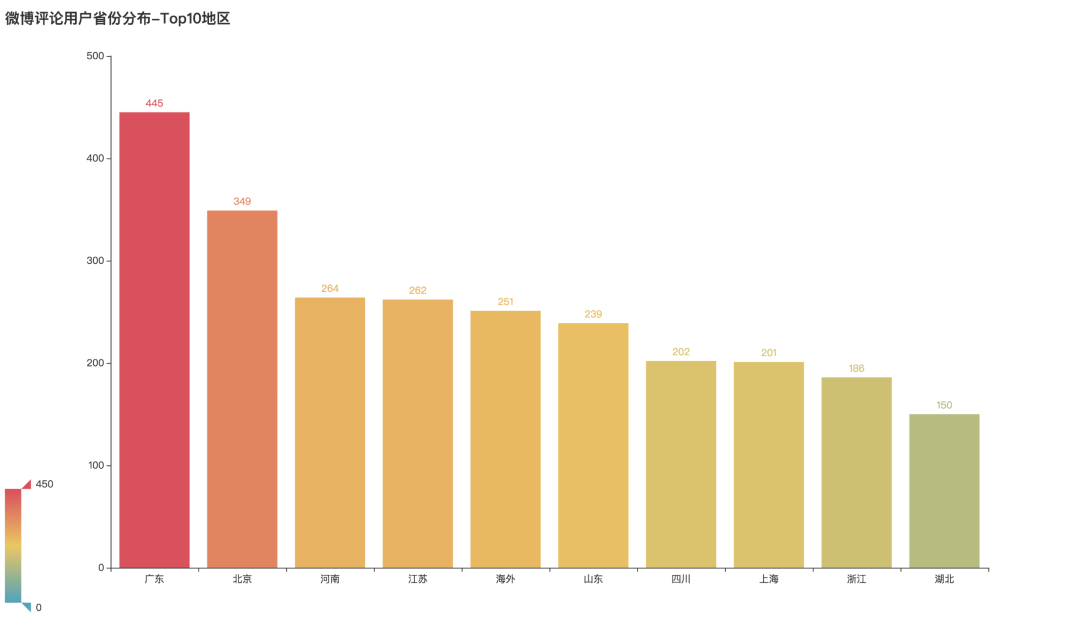
Where are the users from? After analysis and arrangement, we can see that Guangdong, Beijing and Henan have the highest participation, ranking the top three in distribution. Secondly, there are many overseas users in Jiangsu Province.
Age distribution of comment users
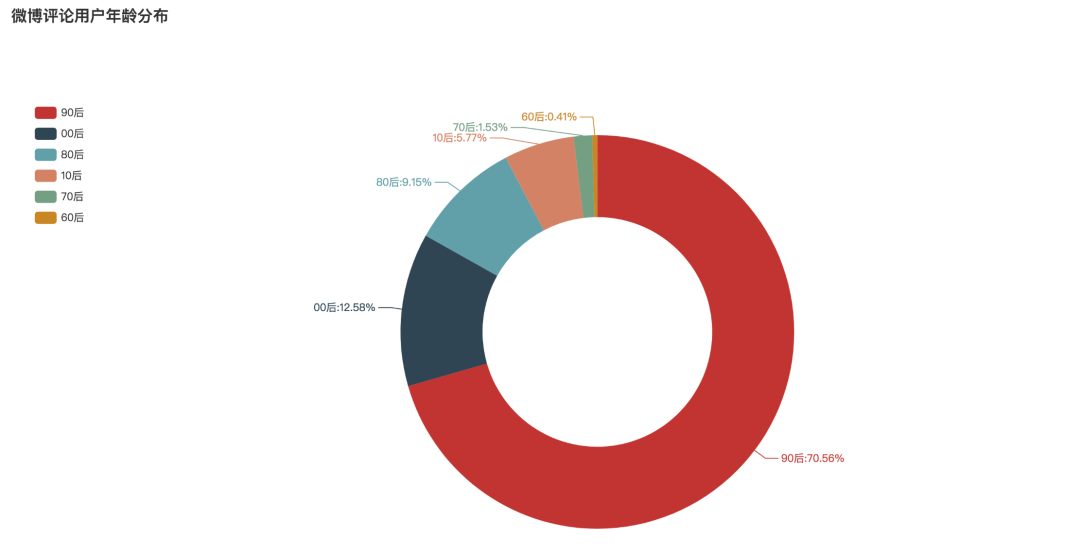
What's the age distribution of users in the topic review of local stall economy? After analysis, it can be seen that the post-90s' participation is the highest, accounting for 70.56%. The second is after 00, accounting for 12.58%. Then the post-80s generation ranked third, accounting for 9.15%.
4. How to analyze microblog data in Python
Data analysis of Weibo comments
We use Python to obtain the hot comment data of microblog stall economic topic and the pop video bullet data of station B, and process and analyze them. The crawler of B station's bullet curtain has been shown before, and here is the key code for commenting on the crawler on Weibo.
The official account returns the key word "stall" to get the complete data.
01 data acquisition
Microblog is divided into: microblog web, microblog mobile, and microblog mobile. This time, we choose mobile( https://m.weibo.cn/ )To grab data.
The website we want to demonstrate is as follows:
https://weibo.com/5382520929/J4UtmkJUJ?type=comment#_rnd1591495913796
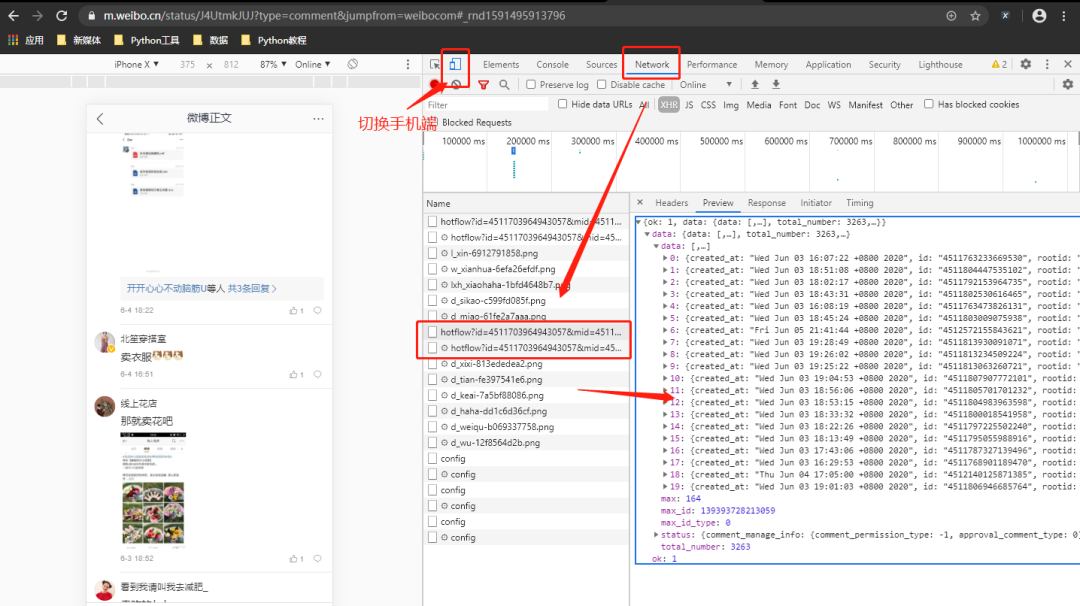
After opening the above URL, use Google browser's packet capturing tool to switch the device to the mobile terminal and refresh the web page again.
Through the analysis of the web page, it can be found that the comment data is loaded through dynamic js, and the real data request address is obtained through the analysis:
https://m.weibo.cn/comments/hotflow?id=4511703964943057&mid=4511703964943057&max_id=140218361800408&max_id_type=0
The parameters are described as follows:
id/mid: comment ID, grab the package.
max_id/max_id_type: in the response data returned from the previous page.
We use requests to get data, use json to parse and extract data. The key code is as follows:
#Import package
import requests
import numpy as np
import pandas as pd
import re
import time
import json
from faker import Factory


def get_weibo_comment(ids, mid, max_page, max_id=0, max_id_type=0):
    """
    //Function: get the comment data of the specified microblog, and switch the data interface from chrome to the mobile terminal to grab packets.
    //Note: there is a limit to the number of each acquisition of this program. After each acquisition, grab it again every 5 minutes
    """
    max_id = max_id
    max_id_type = max_id_type

    #Store data
    df_all = pd.DataFrame()

    for i in range(1, max_page):
        #Print progress
        print('I'm getting the{}Comments on page'.format(i))

        #Get URL
        url = 'https://m.weibo.cn/comments/hotflow?id={}&mid={}&max_id={}&max_id_type={}'.format(ids, mid, max_id, max_id_type)

        #Add headers
        headers = {
            'User-Agent': Factory().create().user_agent(),
            'Referer': 'https://m.weibo.cn/detail/1591254045309',
            'cookie': 'copy cookie information',
            'X-Requested-With': 'XMLHttpRequest',
        }

        #Initiate a request
        try:
            r = requests.get(url, headers=headers, timeout=3)
        except Exception as e:
            print(e)
            r = requests.get(url, headers=headers, timeout=3)

        if r.status_code==200:
            #Parse data
            json_data = json.loads(r.text)

            #Get data
            comment_data = json_data['data']['data']

            created_time = [i.get('created_at') for i in comment_data]
            text = [i.get('text') for i in comment_data]
            user_id = [i['user'].get('id') for i in comment_data]
            screen_name = [i['user'].get('screen_name') for i in comment_data]
            reply_num = [i.get('total_number') for i in comment_data]
            like_count = [i.get('like_count') for i in comment_data]

            # max_id
            max_id = json_data['data']['max_id']
            # max_id_type
            max_id_type = json_data['data']['max_id_type']

            #Store data
            df_one = pd.DataFrame({
                'created_time': created_time,
                'text': text,
                'user_id': user_id,
                'screen_name': screen_name,
                'reply_num': reply_num,
                'like_count': like_count
            })

            #Add
            df_all = df_all.append(df_one, ignore_index=True)

            #Sleep for a second
            time.sleep(np.random.uniform(2))

        else:
            print('Error parsing! Print last value', max_id, max_id_type)
            continue

    return df_all

#Run function
if __name__ == '__main__':
    #Get a Weibo comment
    df = get_weibo_comment(ids='4511703964943057', mid='4511703964943057', max_page=200)
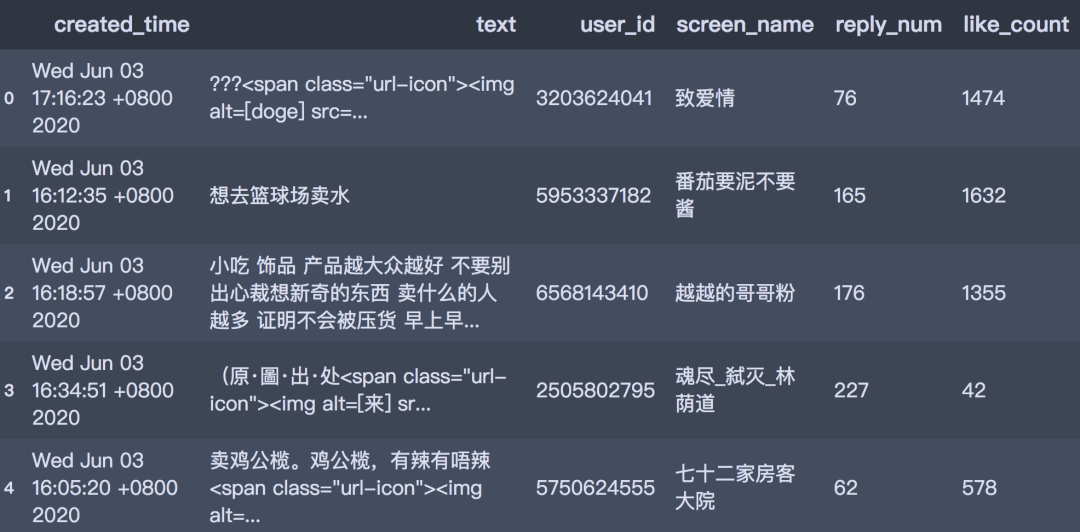
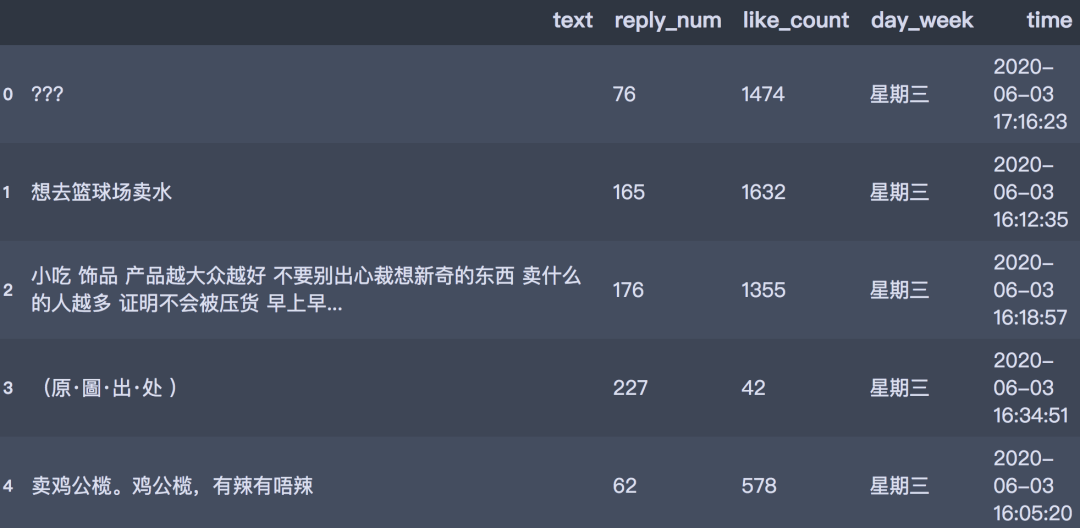
The acquired data is stored in the form of data box, including comment time, comment text, comment user id, number of replies and number of likes. The format is as follows:
df.head()
02 data preprocessing
We preliminarily process the acquired data, mainly including:
-
Duplicate value processing
-
created_time: extract time information
-
text: preliminary cleaning
-
user_id: obtain user related information according to user ID, the steps are omitted.
#Duplicate value
df = df.drop_duplicates()

#Conversion dictionary
week_transform = {
    'Mon': 'Monday',
    'Tue': 'Tuesday',
    'Wed': 'Wednesday',
    'Thu': 'Thursday',
    'Fri': 'Friday',
    'Sat': 'Saturday',
    'Sun': 'Sunday'
}

#Pick up week
df['day_week'] = df['created_time'].str.split(' ').apply(lambda x:x[0])
df['day_week'] = df['day_week'].map(week_transform)

#Extraction date time
df['time'] = df['created_time'].str.split(' ').map(lambda x:x[-1]+'-'+x[1]+'-'+x[2]+' '+x[3])
df['time'] = df.time.str.replace('May', '05').str.replace('Jun', '06')

#text field processing
pattern = '<span.*?</span>|<a.*?</a>'

df['text'] = [re.sub(pattern, '', i) for i in df['text']]

#Delete column
df = df.drop(['created_time', 'user_id', 'screen_name'], axis=1)
The data format after cleaning is as follows:
df.head()
03 data visualization analysis
We use pyecharts and stylecloud for visual analysis, and only part of the code is shown here.
#What kind of business should I do if I set up a stall#
def get_cut_words(content_series):
    #Read in stoppage list
    stop_words = []

    with open("stop_words.txt", 'r', encoding='utf-8') as f:
        lines = f.readlines()
        for line in lines:
            stop_words.append(line.strip())

    #Add keywords
    my_words = ['Dong ci'Da ci ', 'Baked cold noodles', 'Film', 'Sell clothes', 'Set of goose']
    for i in my_words:
        jieba.add_word(i)

    #Define a stop word
    my_stop_words = ['Xingong No', 'Stall', 'Stall', 'street stall', 'Ha ha ha ha', 'mobile phone',
                    'This is', 'where's this?', 'Ha ha ha', 'Really?', 'a thousand', 'major',
                    'Someone', 'i want', 'That', 'can only', 'yummy', 'like', 'Urban management',
                    'comment', 'selling point', 'Is there any', 'Secret script',
                    ]
    stop_words.extend(my_stop_words)

    #Participle
    word_num = jieba.lcut(content_series.str.cat(sep='. '), cut_all=False)

    #Condition screening
    word_num_selected = [i for i in word_num if i not in stop_words and len(i)>=2]

    return word_num_selected
#Participle
text = get_cut_words(content_series=df.text)

#Get top10
shengyi_num = pd.Series(text)
num_top10 = shengyi_num.value_counts()[:10]

#Bar chart
bar1 = Bar(init_opts=opts.InitOpts(width='1350px', height='750px'))
bar1.add_xaxis(num_top10.index.tolist())
bar1.add_yaxis('', num_top10.values.tolist())
bar1.set_global_opts(title_opts=opts.TitleOpts(title='What kind of business should I do if I set up a stall-Top10'),
                     visualmap_opts=opts.VisualMapOpts(max_=150)
                    )
bar1.render()
#Draw word cloud stylecloud.gen_stylecloud(text=' '.join(text), collocations=False, font_path=r'C:\Windows\Fonts\msyh.ttc', #Change to native font icon_name='fas fa-pie-chart', size=768, output_name='What kind of business should I do if I set up a stall.png') Image(filename='What kind of business should I do if I set up a stall.png')