pyecharts: Official documents
Here we use the pyecharts module for drawing.
The pyecharts project contains a series of geographic map data. These data are either built-in or need additional installation and loading. We need to download the following six packages.
Choose the installation you need
pip install echarts-countries-pypkg
pip install echarts-china-provinces-pypkg
pip install echarts-china-cities-pypkg
pip install echarts-china-counties-pypkg
pip install echarts-china-misc-pypkg
pip install echarts-united-kingdom-pypkg
In pyecharts, Geo represents data associated with cities, and Map represents data associated with countries and provinces.
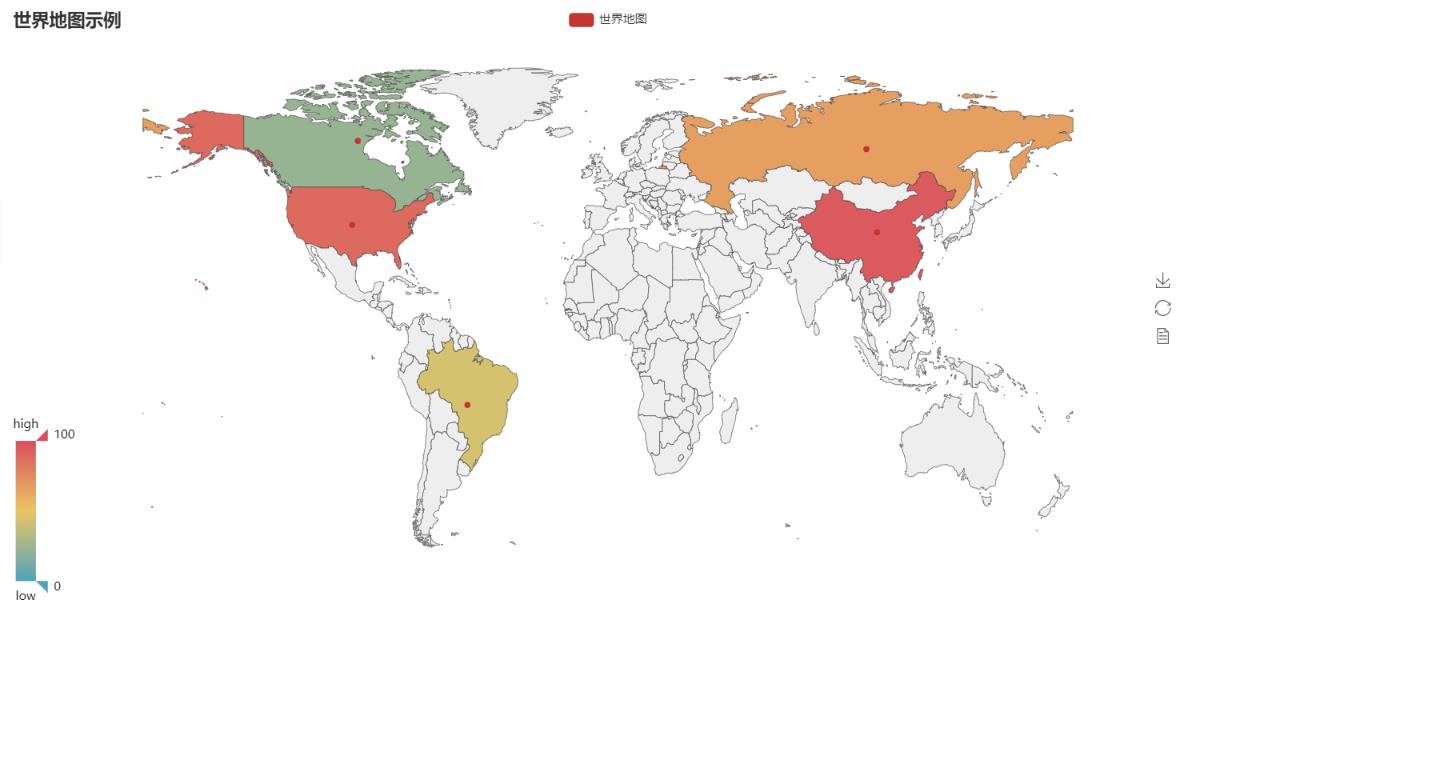
World map
from pyecharts import Map, Geo

# World map data
value = [95.1, 23.2, 43.3, 66.4, 88.5]
attr= ["China", "Canada", "Brazil", "Russia", "United States"]


map0 = Map("World map example", width=1200, height=600)
map0.add("World map", attr, value, maptype="world",  is_visualmap=True, visual_text_color='#000')
map0.render(path="World map.html")
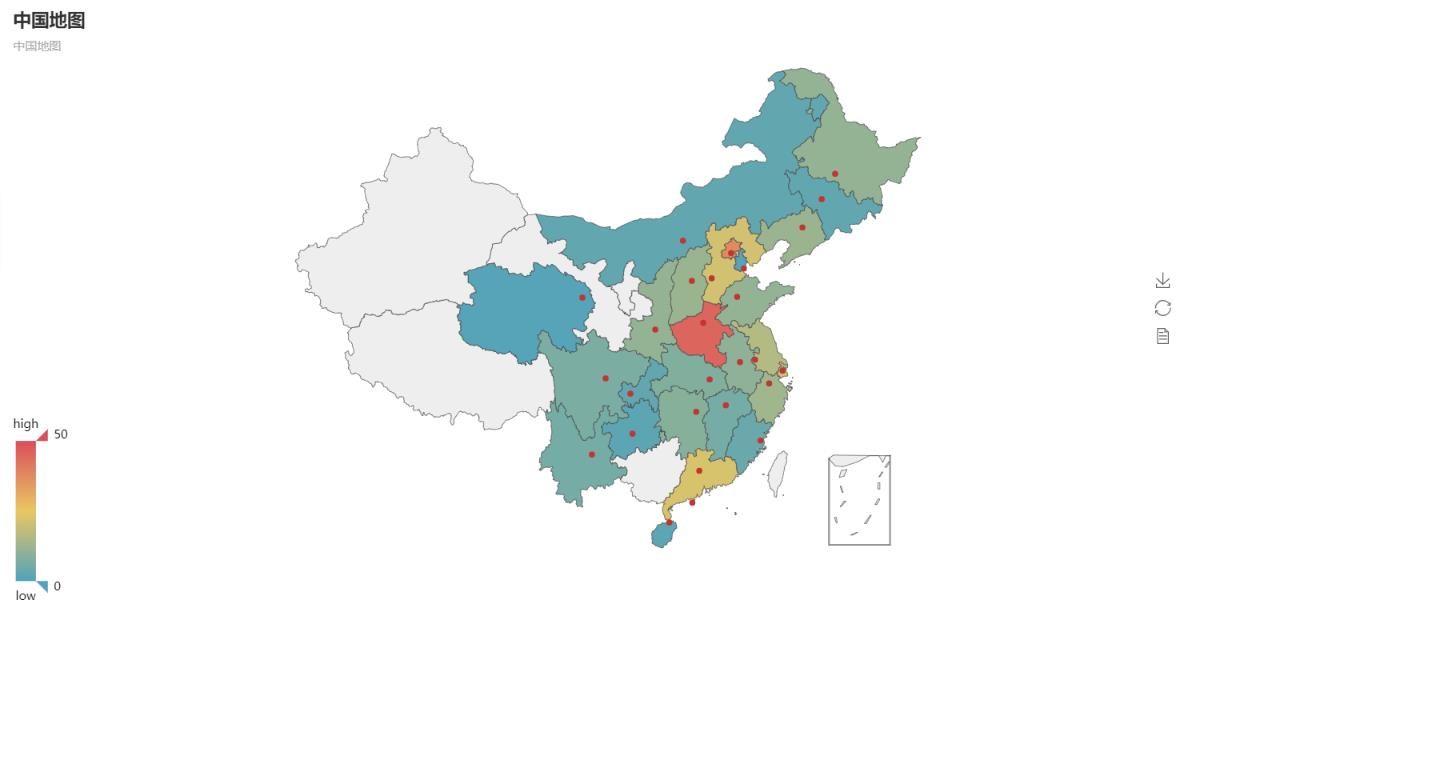
Map of China
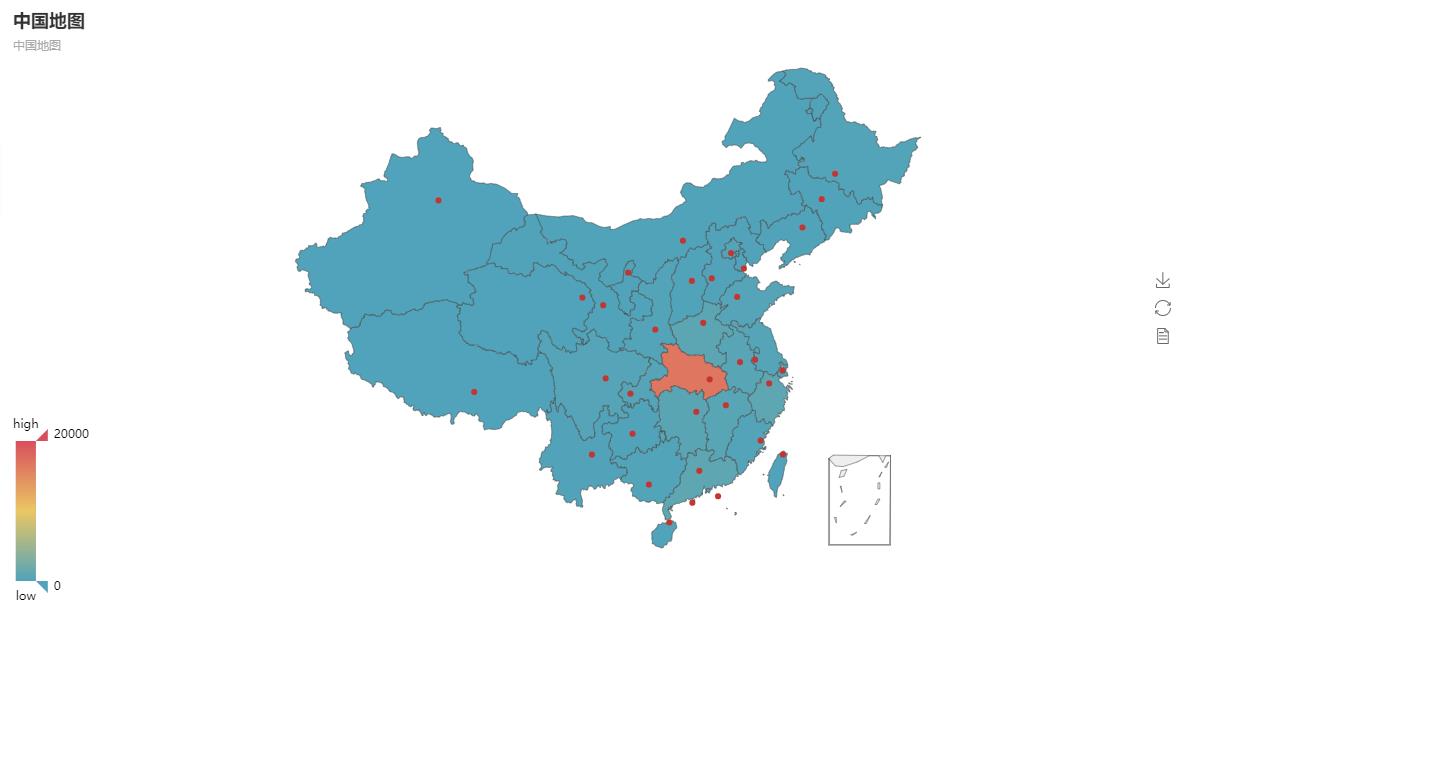
from pyecharts import Map, Geo


# map of China
province_distribution = {'Henan': 45.23, 'Beijing': 37.56, 'Hebei': 21, 'Liaoning': 12, 'Jiangxi': 6, 'Shanghai': 20, 'Anhui': 10, 'Jiangsu': 16, 'Hunan': 9,
                         'Zhejiang': 13, 'Hainan': 2, 'Guangdong': 22, 'Hubei': 8, 'Heilongjiang': 11, 'Macao': 1, 'Shaanxi': 11, 'Sichuan': 7, 'Inner Mongolia': 3, 'Chongqing': 3,
                         'Yunnan': 6, 'Guizhou': 2, 'Jilin': 3, 'Shanxi': 12, 'Shandong': 11, 'Fujian': 4, 'Qinghai': 1, 'Helmsman technology, quality assurance': 1, 'Tianjin': 1,
                         'Other': 1}
provice = list(province_distribution.keys())
values = list(province_distribution.values())
map = Map("map of China",'map of China', width=1200, height=600)
map.add("", provice, values, visual_range=[0, 50],  maptype='china', is_visualmap=True,
visual_text_color='#000')
map.show_config()
map.render(path="map of China.html")
Province Map
from pyecharts import Map, Geo


# City -- City of designated Province xx city
city = ['Zhengzhou City', 'Anyang City', 'Luoyang City', 'Puyang City', 'Nanyang City', 'Kaifeng City', 'Shangqiu City', 'Xinyang City', 'Xinxiang City']
values2 = [1.07, 3.85, 6.38, 8.21, 2.53, 4.37, 9.38, 4.29, 6.1]


map2 = Map("Map of Henan Province",'Henan', width=1200, height=600)
map2.add('Henan', city, values2, visual_range=[1, 10], maptype='Henan', is_visualmap=True, visual_text_color='#000')
map2.show_config()
map2.render(path="Map of Henan Province.html")

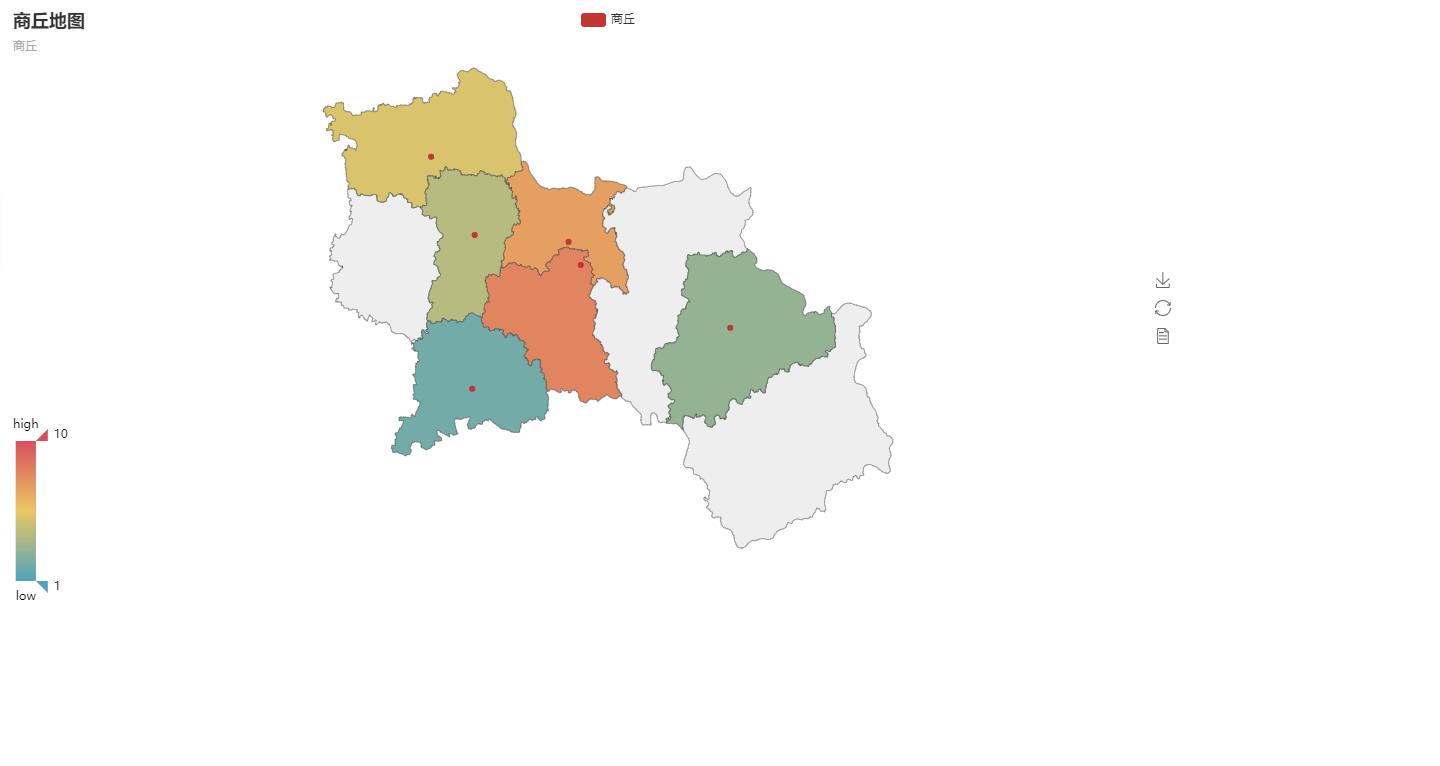
Urban map
from pyecharts import Map, Geo


# District and county -- Districts and counties in specific cities  xx county
quxian = ['Xiayi County', 'Civil rights county', 'Liang Park', 'Suiyang District', 'Zhecheng County', 'Ningling County']
values3 = [3, 5, 7, 8, 2, 4]

map3 = Map("Shangqiu map",'Shangqiu', width=1200, height=600)
map3.add("Shangqiu", quxian, values3, visual_range=[1, 10], maptype='Shangqiu', is_visualmap=True,
visual_text_color='#000')
map3.render(path="Shangqiu map.html")
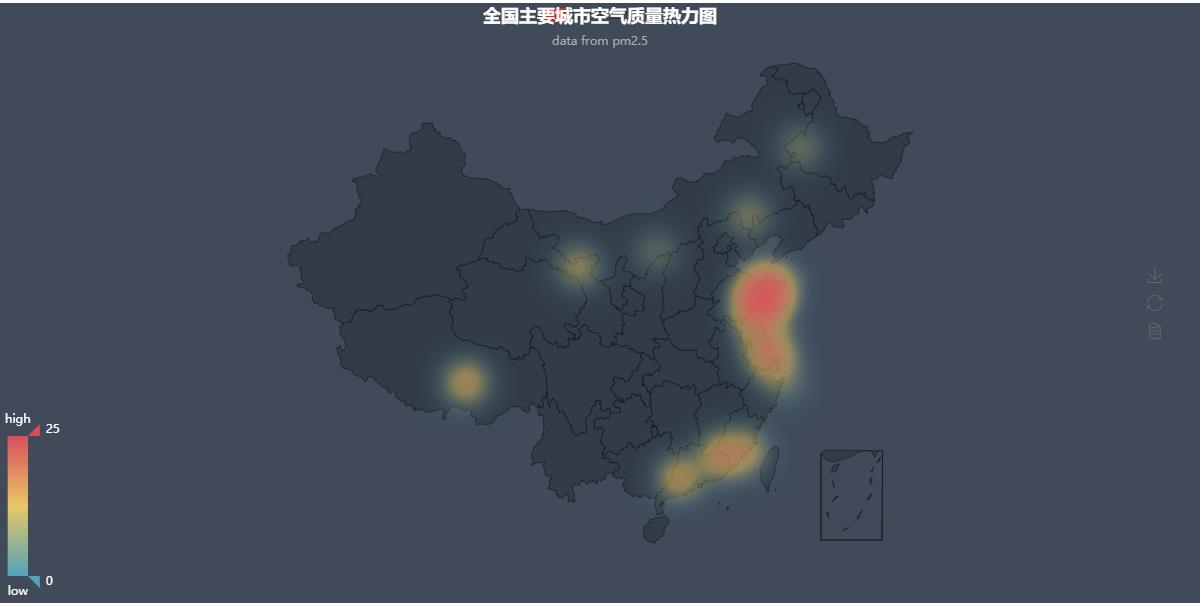
Thermograph
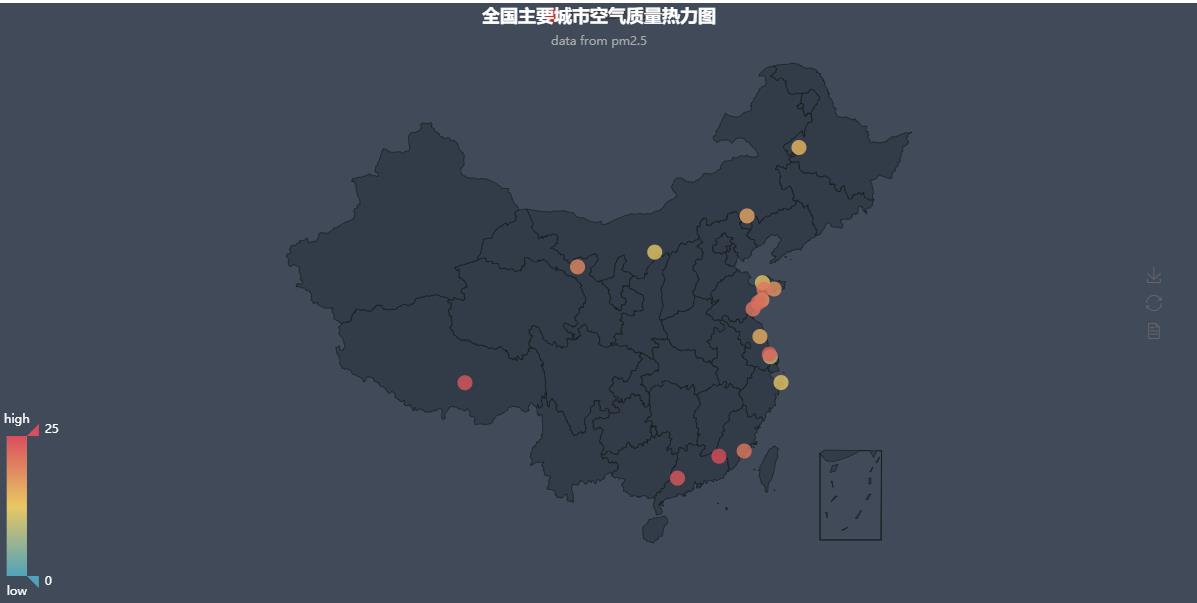
from pyecharts import Map, Geo

data = [
    ("Haimen", 9), ("erdos", 12), ("Zhaoyuan", 12), ("Zhoushan", 12), ("Qiqihar", 14), ("ynz", 15),
    ("Chifeng", 16), ("Qingdao", 18), ("Rushan", 18), ("Jinchang", 19), ("Quanzhou", 21), ("Laixi", 21),
    ("sunshine", 21), ("Jiaonan", 22), ("Nantong", 23), ("Lhasa", 24), ("Yunfu", 24), ("Meizhou", 25)]

attr, value = Geo.cast(data)

geo = Geo("Thermal map of air quality of major cities in China", "data from pm2.5", title_color="#fff", title_pos="center", width=1200, height=600,
          background_color='#404a59')

geo.add("Thermodynamic diagram of air quality", attr, value, visual_range=[0, 25], type='heatmap', visual_text_color="#fff", symbol_size=15,
        is_visualmap=True, is_roam=False)
geo.show_config()
geo.render(path="Thermodynamic diagram of air quality.html")
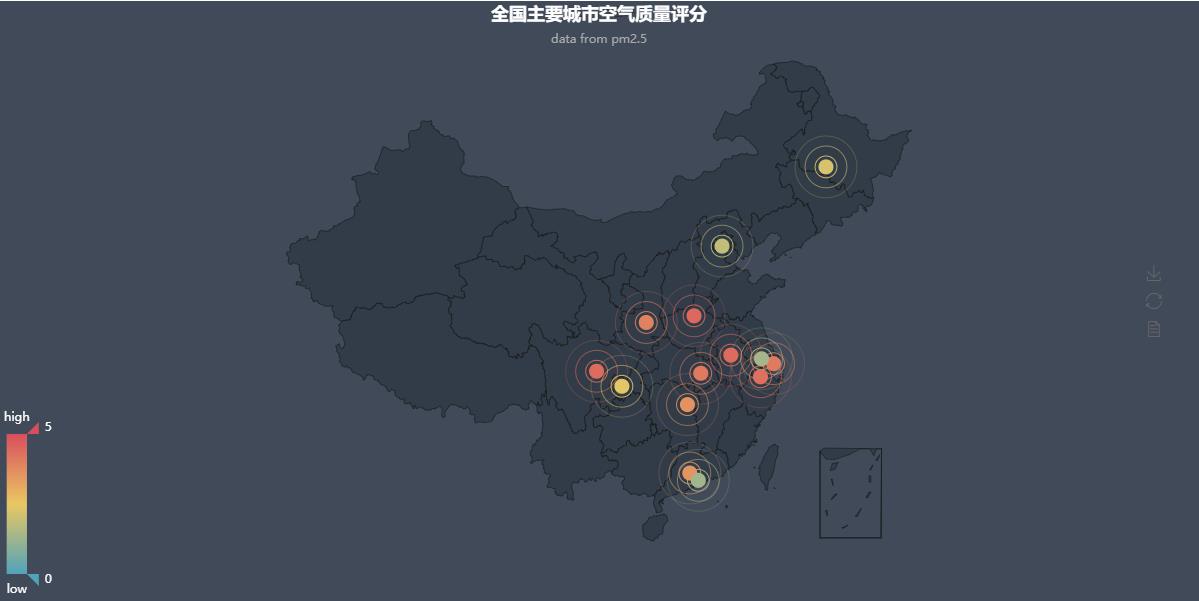
from pyecharts import Map, Geo

indexs = ['Shanghai', 'Beijing', 'Hefei', 'Harbin', 'Guangzhou', 'Chengdu', 'Wuxi', 'Hangzhou', 'Wuhan', 'Shenzhen', 'Xi'an', 'Zhengzhou', 'Chongqing', 'Changsha']
values = [4.07, 1.85, 4.38, 2.21, 3.53, 4.37, 1.38, 4.29, 4.1, 1.31, 3.92, 4.47, 2.40, 3.60]
geo = Geo("Air quality rating of major cities in China", "data from pm2.5", title_color="#fff", title_pos="center", width=1200, height=600,
          background_color='#404a59')

# type="effectScatter", is_random=True, effect_scale=5  Make points divergent
geo.add("Air quality score", indexs, values, type="effectScatter", is_random=True, effect_scale=5, visual_range=[0, 5],
        visual_text_color="#fff", symbol_size=15, is_visualmap=True, is_roam=False)
geo.show_config()
geo.render(path="Air quality score.html")
from pyecharts import Map, Geo


data = [
    ("Haimen", 9), ("erdos", 12), ("Zhaoyuan", 12), ("Zhoushan", 12), ("Qiqihar", 14), ("ynz", 15),
    ("Chifeng", 16), ("Qingdao", 18), ("Rushan", 18), ("Jinchang", 19), ("Quanzhou", 21), ("Laixi", 21),
    ("sunshine", 21), ("Jiaonan", 22), ("Nantong", 23), ("Lhasa", 24), ("Yunfu", 24), ("Meizhou", 25)]

attr, value = Geo.cast(data)

geo = Geo("Thermal map of air quality of major cities in China", "data from pm2.5", title_color="#fff", title_pos="center", width=1200, height=600,
          background_color='#404a59')

geo.add("Thermodynamic diagram of air quality", attr, value, visual_range=[0, 25], type='scatter', visual_text_color="#fff", symbol_size=15,
        is_visualmap=True, is_roam=False)
geo.show_config()
geo.render(path="Mass thermograph.html")
Example: capture and visualize coronavirus infection data
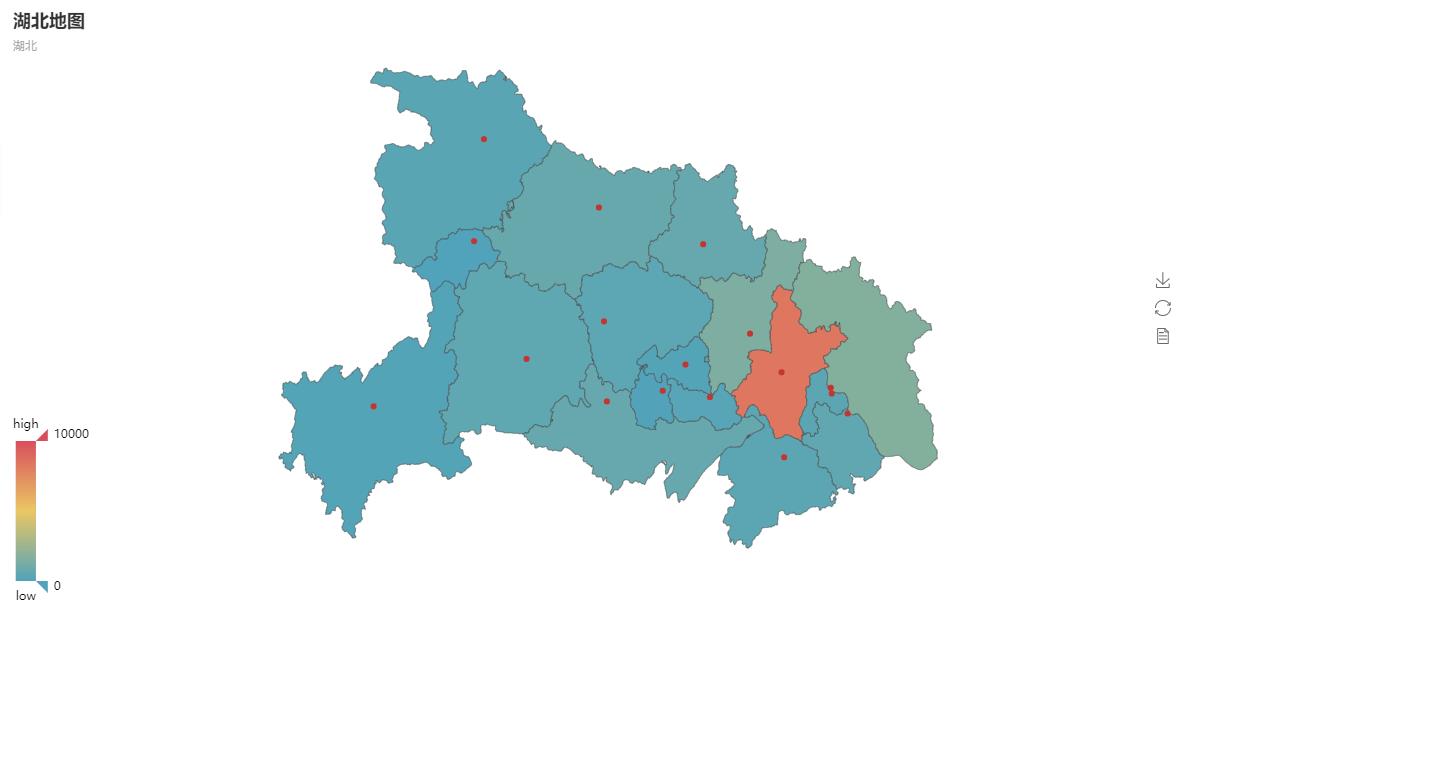
import urllib
import urllib.request
import json
import os
import prettytable as pt
from pyecharts import Map, Geo

class Searchdata(object):
    def __init__(self,url):
        self.url = url
        self.china_list = {}
        self.china_data = {}
        self.province_list = {}
        self.province_data = {}
    def get_data(self):
        try:
            data = urllib.request.urlopen(self.url)
            data = json.loads(data.read())
            self.save(data)
            return data
        except:
            print("Request data error!")

    def is_exist(self):
        for i in os.listdir(os.getcwd()):
            if i == "data.txt":
                return 1
        return 0

    def save(self,data):
        if self.is_exist() == 0:
            with open("data.txt",'w') as fp:
                fp.write(str(data))

    def get_china(self,data):
        data = data['data']
        self.china_data['total'] = data['gntotal']
        self.china_data['deathNum'] = data['deathtotal']
        self.china_data['susNum'] = data['sustotal']
        self.china_data['cureNum'] = data['curetotal']
        for i in data['list']:
            dic ={}
            dic['total'] = i['value']
            dic['deathNum'] = i['deathNum']
            dic['susNum'] = i['susNum']
            dic['cureNum'] = i['cureNum']
            self.china_list[i['name']] = dic

    def get_province(self,data):
        data = data['data']
        for i in data['list']:
            if i['name'] == 'Hubei':
                self.province_data['total'] =  i['value']
                self.province_data['deathNum'] =  i['deathNum']
                self.province_data['susNum'] =  i['susNum']
                self.province_data['cureNum'] =  i['cureNum']
                for temp in i['city']:
                    dic = {}
                    dic['total'] = temp['conNum']
                    dic['deathNum'] = temp['deathNum']
                    dic['susNum'] = temp['susNum']
                    dic['cureNum'] = temp['cureNum']
                    self.province_list[temp['name']] = dic
                return
    def get_sheet1(self):
        self.tb = pt.PrettyTable()
        self.tb.field_names = ["Province", "Total", "death", "Suspected", "Cure"]
        for k, v in self.china_list.items():
            self.tb.add_row([k, v['total'], v['deathNum'], v['susNum'],v['cureNum']])
        self.tb.add_row(['Total', self.china_data['total'],self.china_data['deathNum'], self.china_data['susNum'], self.china_data['cureNum']])
        print(self.tb)

    def get_sheet2(self):
        self.tb = pt.PrettyTable()
        self.tb.field_names = ["Prefecture level city", "Total", "death", "Suspected", "Cure"]
        for k, v in self.province_list.items():
            self.tb.add_row([k, v['total'], v['deathNum'], v['susNum'], v['cureNum']])
        self.tb.add_row(['Total', self.province_data['total'], self.province_data['deathNum'],
                         self.province_data['susNum'], self.province_data['cureNum']])
        print(self.tb)

    def get_graph1(self):
        provice = list(self.china_list.keys())
        values = []
        for k, v in self.china_list.items():
            values.append(v['total'])
        # map of China
        map = Map("map of China", 'map of China', width=1200, height=600)
        map.add("", provice, values, visual_range=[0, 20000], maptype='china', is_visualmap=True,
                visual_text_color='#000')
        map.show_config()
        map.render(path="Map.html")


    def get_graph2(self):
        city =  list(self.province_list.keys())

        new_city = []
        for str in city:
            if len(str) == 2:
                str = str+"city"
                new_city.append(str)
            elif len(str) == 3:
                str = "Enshi Tujia and Miao Autonomous Prefecture "
                new_city.append(str)
            else:
                new_city.append(str)
        values = []
        for k, v in self.province_list.items():
            values.append(v['total'])
        map2 = Map("Map of Hubei Province", 'Hubei', width=1200, height=600)
        map2.add('', new_city, values, visual_range=[0,10000], maptype='Hubei', is_visualmap=True, visual_text_color='#000')
        map2.show_config()
        map2.render(path="Map of Hubei Province.html")


Searchtool =Searchdata('http://43.250.238.179:9090/showData')

data = Searchtool.get_data()
Searchtool.get_province(data)
Searchtool.get_sheet2()
Searchtool.get_graph2()
refer:
http://pyecharts.herokuapp.com/
https://05x-docs.pyecharts.org/#/
The most complete pyecharts data visualization, 30 minutes to learn