I. Preface
The provincial and municipal area map can also be called the provincial and municipal outline map, which is to turn the border area of each province and urban area into an outline display. It is only a general outline, basically consistent with the real map. After all, it is piled up one by one, which may have a very small error. When making the map of China in the middle of the large screen system, the customer made every effort to explain clearly, and must pay attention to it There are nine sections of lines in Italy, otherwise it will be scolded to death if it is seen in the exhibition that there are not even nine sections of lines. It is possible that some of the early data are not very perfect, so they may not exist. The latest map data in the later period are all available, including the contour map data.
Echart itself does not provide the contour map of provinces and cities. It needs to introduce external js files to draw. In order to get the corresponding contour map js files of all provinces and cities in the country, we went to the Internet to search for a lot of relevant articles and understand them, downloaded the json data of the corresponding provinces and cities and regions, and specially wrote a class to convert the json data to the js file according to the rules of js The js files of all provinces and cities are generated. Only the js files are needed in the echart. These js files are available in the download address. As for the outline of these areas, I don't understand the specific meaning of some messy symbols. If you say base64 coding, it's not like to look at it carefully. Whatever it is, it's OK to use it correctly We also need to study the source code of echart.
The previous flicker point map or migration map used the outline map of China map as the background, which can be zoomed by mouse. In fact, svg can achieve similar effect, similar to vector map. In addition to China map, there can also be world map. As for the map estimation of other countries in the world, it needs to be transformed by other ways, so it should be There are many applications for foreign customers.
2, Functional features
- At the same time, it supports flicker point map, migration map, area map, dashboard, etc.
- You can set various colors such as title, prompt, background color, text color, line color, area color, etc.
- You can set the name, value, longitude and latitude of a city.
- You can set the magnification of the map and whether to allow the mouse wheel to zoom.
- Built in world map, national map, province map, region map, can be accurate to the county, all maps are offline.
- The built-in json data file to js file function of all provinces and cities. If there is data update, it can be converted by itself. It supports single file conversion and one key conversion of all files.
- It has built-in function of getting all the names and longitude and latitude information sets of the region from json file or js file, which can be used to display the information through this method.
- It depends on the browser component to display the map, and the demo supports webkit, webengine and ie to load the web page.
- It has a strong expansibility. You can add all kinds of exquisite echarts components by yourself to make the effect of Niubi.
- The built-in dashboard component provides interactive functions, and the demo demo contains the corresponding code.
- Function interface is friendly and unified, easy to use, just one class.
- Support any Qt version, any system, any compiler.
3, Experience address
- Experience address: https://pan.baidu.com/s/1uQsDQO5E5crUBN2J-nPeLQ Extraction code: 1jkp file name: bin_map.zip
- Domestic site: https://gitee.com/feiyangqingyun
- International site: https://github.com/feiyangqingyun
- Personal homepage: https://blog.csdn.net/feiyangqingyun
- Zhihu homepage: https://www.zhihu.com/people/feiyangqingyun/
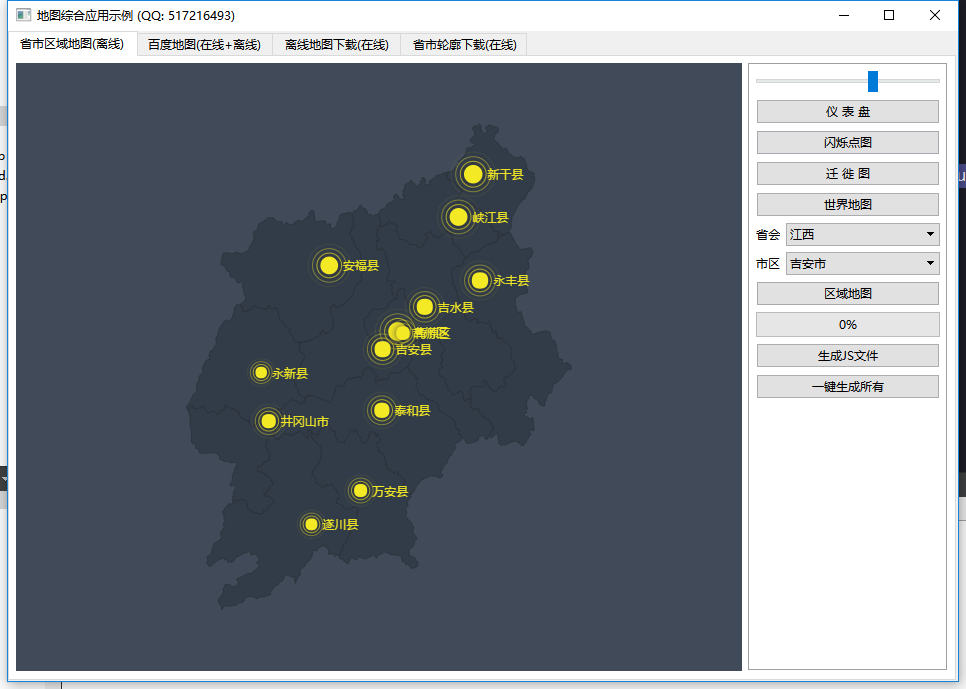
4, Renderings
5, Related code
QStringList EchartJs::getInfoFromData(const QByteArray &data)
{
    //Take out the corresponding city name and longitude and latitude
    //The following two methods test the parsing time, json is about 1S, string segmentation is about 5S, and json method is faster
    QStringList result;
#if (QT_VERSION > QT_VERSION_CHECK(5,0,0))
    //Analysis with json method built in qt
    QJsonParseError error;
    QJsonDocument jsonDoc = QJsonDocument::fromJson(data, &error);
    if (error.error == QJsonParseError::NoError) {
        QJsonObject rootObj = jsonDoc.object();
        //qDebug() << rootObj.keys();

        if (rootObj.contains("features")) {
            QJsonArray features = rootObj.value("features").toArray();
            for (int i = 0; i < features.count(); i++) {
                QJsonValue value = features.at(i);
                QJsonObject subObj = value.toObject();
                if (subObj.contains("properties")) {
                    QJsonObject nodeObj = subObj.value("properties").toObject();
                    QStringList list;
                    QJsonArray array = nodeObj.value("cp").toArray();
                    for (int k = 0; k < array.count(); k++) {
                        list << QString::number(array.at(k).toDouble());
                    }

                    QString name = nodeObj.value("name").toString();
                    QString cp = list.join(",");
                    result << QString("%1|%2").arg(name).arg(cp);
                }
            }
        }
    }
#else
    //Analysis by string segmentation
    QString temp = data;
    temp = temp.mid(0, temp.length() - 24);
    QString flag = "properties";
    int len = temp.length();
    for (int i = 0; i < len; i++) {
        QString str = temp.mid(i, 10);
        if (str == flag) {
            str = temp.mid(i, 100);
            str = str.mid(13, str.indexOf("},") - 13);
            str = str.replace("}", "");
            //At this point, the data has become "cp":[121.490317,31.222771],"name": "Huangpu District", "childNum":1
            //The order of cp name may be different, so you need to split the string and judge again
            QString name, cp;
            QStringList list = str.split(",");
            foreach (QString s, list) {
                if (s.startsWith("\"cp\"")) {
                    cp = s.mid(6, s.length());
                } else if (s.startsWith("\"name\"")) {
                    name = s.mid(8, s.length());
                    name = name.replace("\"", "");
                } else if (s.startsWith("\"childNum\"")) {

                } else {
                    //The longitude and latitude will be divided into two parts, one of which is here 31.222771]
                    cp = QString("%1,%2").arg(cp).arg(s.left(s.length() - 1));
                }
            }

            result << QString("%1|%2").arg(name).arg(cp);
        }
    }
#endif
    return result;
}