1. Install filebeat to the target machine
Official installation documents
This test uses windows environment to install filebeat
win:
1. Download the Filebeat Windows zip file from the downloads page.
2. Extract the contents of the zip file into C:\Program Files.
3. Rename the filebeat--windows directory to Filebeat.
4. Open a PowerShell prompt as an Administrator (right-click the PowerShell icon and select Run As Administrator). If you are running Windows XP, you may need to download and install PowerShell.
From the PowerShell prompt, run the following commands to install Filebeat as a Windows service:
PS > cd 'C:\Program Files\Filebeat'
PS C:\Program Files\Filebeat> .\install-service-filebeat.ps1
2. Configure filebeat
Since version 6.0, document type is no longer supported
Starting with Logstash 6.0, the document_type option is deprecated due to the removal of types in Logstash 6.0. It will be removed in the next major version of Logstash. If you are running Logstash 6.0 or later, you do not need to set document_type in your configuration because Logstash sets the type to doc by default.
So in order for lostash to distinguish logs sent from different directories, we use the tags attribute
tags
A list of tags that the Beat includes in the tags field of each published event. Tags make it easy to select specific events in Kibana or apply conditional filtering in Logstash. These tags will be appended to the list of tags specified in the general configuration.
Modify the configuration file filebeat.yml of filebeat
Modify it to the following configuration, open two prospectors, collect logs under two directories, and support the same writing method: / var/log/*/*.log
filebeat.prospectors:
- type: log
  # Change to true to enable this prospector configuration.
  enabled: true
  # Paths that should be crawled and fetched. Glob based paths.
  paths:
    - d:\IISlog\xxx.xxx.xxx\W3SVC12\*.log
  tags: ["iislog1"]
- type: log
  enabled: true
  paths:
    - d:\IISlog\xxx.xxx.xxx\W3SVC13\*.log
  tags: ["iislog2"]
Also add configuration output to lostash
output.logstash:
  # The Logstash hosts
  hosts: ["xx.xx.xx.xx:5044"]
3. Modify the shipper configuration file of the front-end lostash
Open the beat collection port and send it to redis
Determine whether the tags contain the keywords we set in the filebeat configuration according to the directory and put them into redis
input{
        beats {
            port => 5044
        }
}
output{
    if "iislog1" in [tags]{    #Write iislog log to redis
    redis  {
                host => "172.16.1.176"
                port => "6379"
                db => "3"
                data_type => "list"
                key => "iislog1"
        }
    }
    if "iislog2" in [tags]{    #Write iislog log to redis
    redis  {
                host => "172.16.1.176"
                port => "6379"
                db => "3"
                data_type => "list"
                key => "iislog2"
        }
    }
}
4. Modify the indexer configuration file of the backend lostash
input{
        redis  {
                host => "172.16.1.176"
                port => "6379"
                db => "3"
                data_type => "list"
                key => "iislog1"
                type => "iislog1"
        }
        redis  {
                host => "172.16.1.176"
                port => "6379"
                db => "3"
                data_type => "list"
                key => "iislog2"
                type => "iislog2"
        }
}
output{
    if [type] == "iislog1" {      #Write iislog log to es
         elasticsearch{
          hosts => ["172.16.1.176:9200"]
          index => "iislog1-%{+YYYY.MM.dd}"
        }
    }
    if [type] == "iislog2" {      #Write iislog log to es
         elasticsearch{
          hosts => ["172.16.1.176:9200"]
          index => "iislog2-%{+YYYY.MM.dd}"
        }
    }
}
5. Test effect
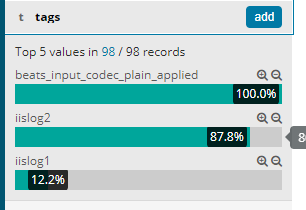
Start ELK, enter kibana, and then manually write some logs, or generate some logs. You can see that 
In kibana, you can see that tags distinguish logs of different directories. Similarly, tags can also distinguish logs of different directories in the filter plugin of lostash to do different operations