A common way of fixed investment of a fund is to apply for a fixed share of the fund from the fund company during a fixed period of time each week or month.Fund fixed investment can average costs, spread risks and achieve automatic investment, so fund fixed investment is also called "lazy investment technique".Today, we mainly use python to take you to analyze, from the statistical data, when on earth will the fixed investment get the most profit probability.
(This is a learning discussion, not an investment proposal)
The overall idea: Select a certain period of time, simulate fixed investment from Monday to Friday, compare the final benefits, and determine the most appropriate time for fixed investment of the fund.
Here's how to start:
Step 1: Site analysis, data exchange url analysis
Take Tiantian Fund Network as an example, to find any fund
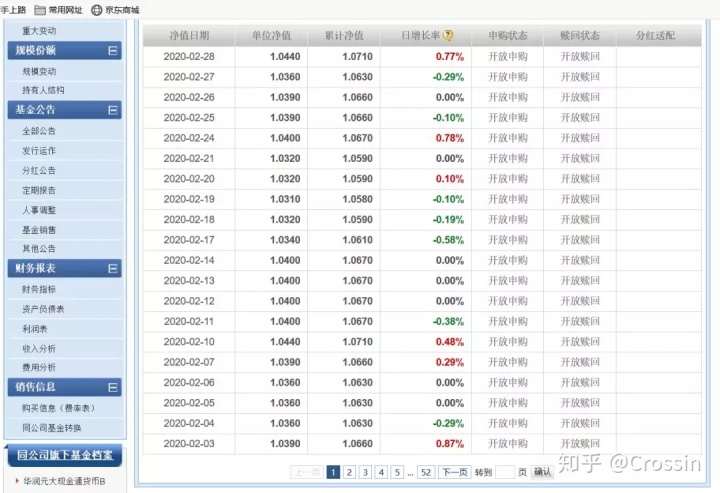
Open the developer tools that come with Chrome, click on the next page, and find the data transfer interface from the Network page (see Developer Tools for more information on using them) Crossin: A crawler tool that solves half of the problem)

Click on this request to open the response data
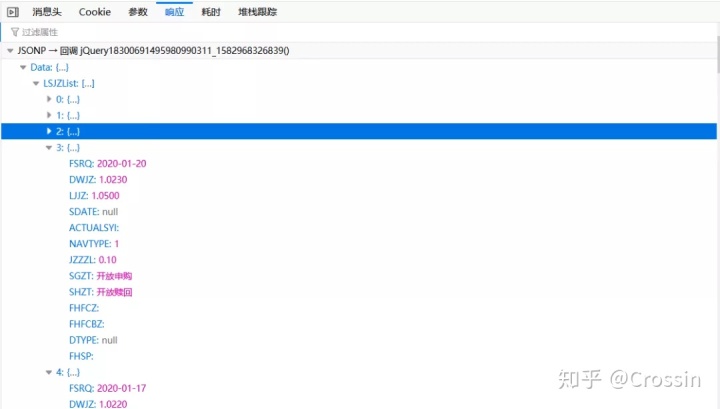
That's it. Next, let's look at the url's parameters

Callback can ignore that fundcode is the fund code, pageIndex is the current page number, pageSize is the number of returned data bars, 20 bars are returned here at a time, startData and endData are the start and end times, respectively, but they are empty values, and the last parameter is ignored.
Step 2: requests simulates the request and gets the data
Normally, it should be a for loop, which fetches data page by page, but we can see from the first step that the url parameter contains start and end time, so we can try, can ignore the page number information, get the return data at the end of time, change the url structure, and start simulating the request:
startDate = '2018-01-13'  #Start time
endDate = '2020-02-28'   #Deadline
header = {
    'User-Agent': 'Mozilla/5.0 (Windows NT 6.1; Win64; x64; rv:69.0) Gecko/20100101 Firefox/69.0',
    'Referer': 'http://fundf10.eastmoney.com/jjjz_{0}.html'.format(fundCode)
}
url = 'http://api.fund.eastmoney.com/f10/lsjz?fundCode={0}&pageIndex={1}&pageSize=5000&startDate={2}&endDate={3}&_=1555586870418?'.format(fundCode, pageIndex, startDate, endDate)
response = requests.get(url, headers=header)
result=json.loads(response.text)
print(result)
for j in result['Data']['LSJZList']:
    print(j)
Return data is
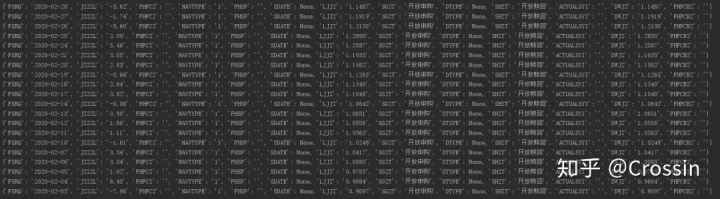
It is true that data can be returned in this url structure, but there seem to be only 20, initially thought to be a limitation of the website interface, and finally found that pageSize is not set, the susceptibility is set directly to 5000, again
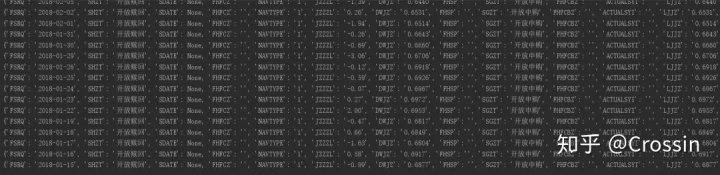
That's all out.
Step 3: Construct a model to simulate fixed investment and calculate final income
The specific process is as follows:
First convert the date to a week, then classify Monday to Friday. Take Friday fixed investment as an example, where each fixed investment is 100. Convert the amount of each fixed investment into shares according to the net value of the day, and then add up with the previous shares:
total = [0] * 5   # Total Share After Expiration
count = [0] * 5   # Number of daily subscriptions
for j in result['Data']['LSJZList'][::-1]:
    if j['JZZZL']=='':
        pass
    else:
        weekday = int(datetime.strptime(j['FSRQ'], '%Y-%m-%d').weekday())
        DWJZ = float(j['DWJZ'])   # net worth
        total[weekday] = total[weekday]+money/DWJZ
        count[weekday] += 1
Finally, the share is converted to an amount based on the final net value:
total_money=[]   #Calculate total amount based on share
for t, i in enumerate(total):
    total_money.append(i*DWJZ)
    print("week{0}Final fixed amount{1}".format(t+1, i*DWJZ), "Fixed Projection{0}second".format(count[t]))
Return results:
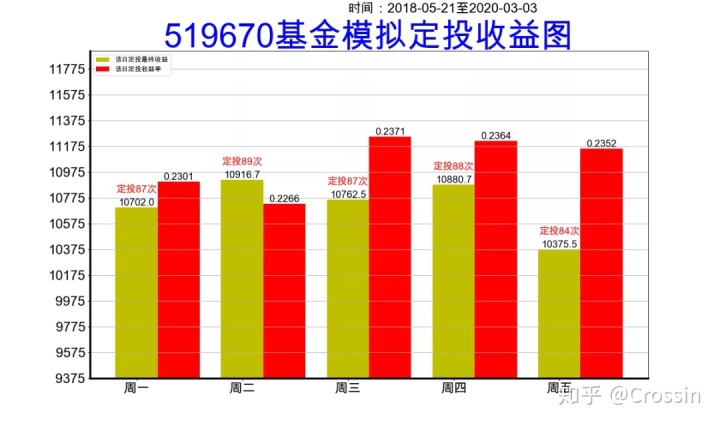
Week 1 final amount of 10702.031523199748 fixed 87 times
 Week 2 final amount 10916.721436831616 fixed 89 times
 Week 3 final amount 10762.509365370352 fixed 87 times
 Week 4 final amount of 10880.683965470516 fixed 88 times
 Week 5 final amount 10375.517539233546 fixed 84 times
Step 4: Draw a column with matplotlib
1. First set up the normal display Chinese label, SimHei is Chinese font, use plt.figure to build a 15x8 canvas, set the title content, font color, font thickness and size
plt.rcParams['font.sans-serif'] = ['SimHei']  # windows is used to display Chinese labels normally
# plt.rcParams["font.family"] = 'Arial Unicode MS'  # mac is used to display Chinese labels normally
plt.figure(figsize=(15, 10), dpi=80)
plt.title('{0}Funds Simulated Fixed Investment Income Graph'.format(fundCode), color='blue', fontweight=800, size=50)
profit_list = [round((i-100*j)/(100*j), 4) for i, j in zip(total_money, count)]  # Total rate of return after maturity
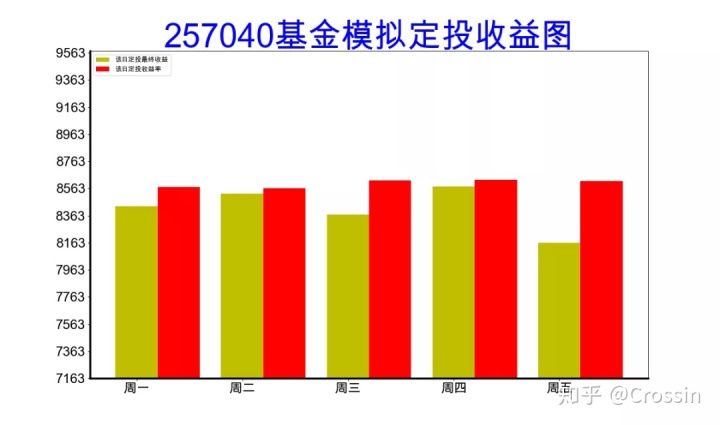
The results are as follows:
2. Then use plt.bar to draw the column size, the first one represents the probability of the day's growth, the second is the cumulative gain of the day, the label parameter in plt.bar is the label, but to use plt.legend to stop the label from coinciding with the image, adjust the y-axis coordinate range for viewing, and finally set the axis thickness.
name_list = ['Monday', 'Tuesday', 'Wednesday', 'Thursday', 'Friday']
x = range(len(name_list))
minytick=int(min(total_money))-1000
maxytick=int(max(total_money))+1000
plt.bar(x, [i for i in total_money], label='Final return on fixed investment for the day', width=0.4, color='y')
# The parameters m, m2, r are used to adjust the height scale
m = sum(total_money) / 5
m2 = min(profit_list)
r = 50000
plt.bar([i+0.4 for i in x], [(i-m2)*r + m for i in profit_list], label='Rate of return on fixed investment for the day', width=0.4, color='r')
plt.legend(loc="upper left")  # Prevent label and image from overlapping
plt.xticks(x, name_list, size=20)   # x-coordinate
plt.ylim(minytick, maxytick)
plt.yticks(range(minytick, maxytick, 200), size=20) # y-coordinate
ax = plt.gca();#Get handle to axis
ax.spines['left'].set_linewidth(3) ; ####Set the thickness of the left coordinate axis
ax.spines['bottom'].set_linewidth(3) ; ###Set the thickness of the bottom axis
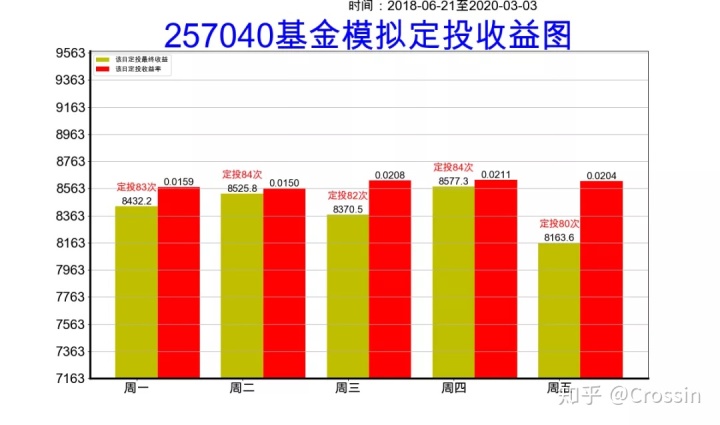
3. Perfect label, grid, text and other settings
for a, b, c in zip(x, total_money, count):
    plt.text(a, b+0.05, '%.1f' % b, ha='center', va='bottom', fontsize=15)
    plt.text(a, b+100, 'Fixed Projection{}second'.format(c), ha='center', va='bottom', fontsize=15, color='r')
for a, b in zip(x, profit_list):
    plt.text(a+0.4, (b-m2)*r + m, '%.4f' % b, ha='center', va='bottom', fontsize=15)

plt.text(2, maxytick+300, 'Time:{0}to{1}'.format(startDate, endDate), fontsize=20)
plt.grid(axis="y")  #Generate grid'''
Step 5: Statistical Analysis
Let's try a few more different funds at different times and draw a histogram:
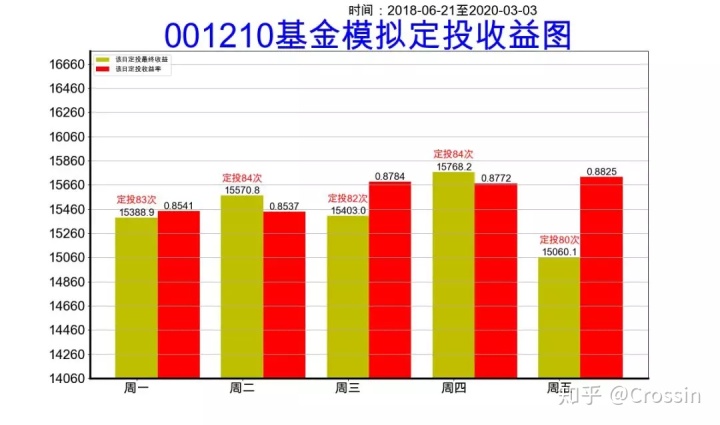
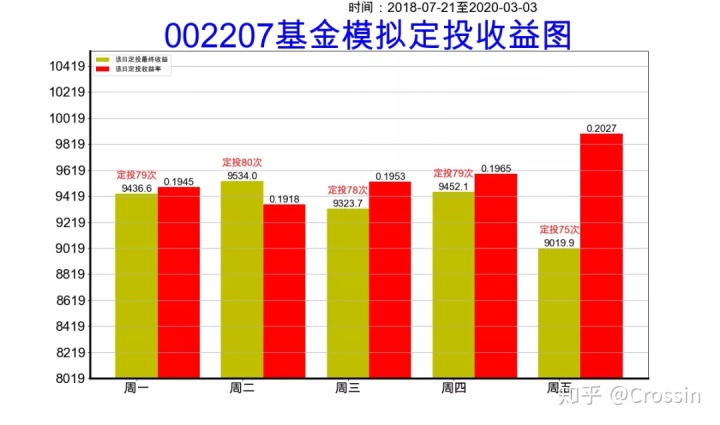
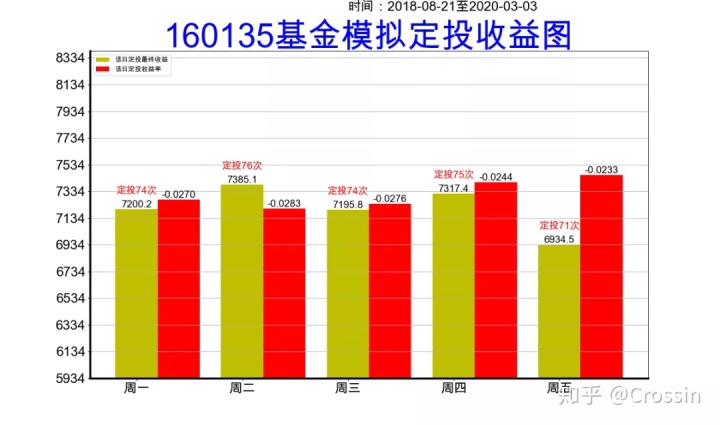
It is difficult to see the law from just a few examples.So further, we randomly select 10 funds, and then randomly select 10 time periods to draw a scatterplot of the distribution of earnings, and calculate the average value:
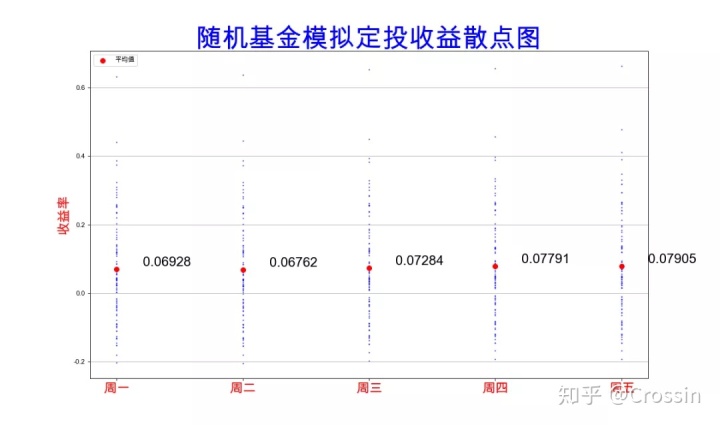
From the above statistical results, Thursday's and Five-day fixed investment usually outweigh Monday's and Tuesday's fixed investment.
However, the amount of data we have selected here is not large, and you can also add more fund codes and time in the code to test.
Of course, the results of this demonstration are only for reference. Stock market changes are unpredictable and it is impossible to predict them completely. Please exercise caution.
------
Welcome to Search & Attention: Crossin's Programming Classroom
There's more to it.Learning Together, Going Far