Why is it called a thermostat. We name the system according to its ability to adapt to market, shock and trend. The system comes from our observation of the success of a particular system in a particular market area. This system can create dual strategies to make full use of the two models of the market.
First, we create a function to help determine the market pattern. According to the output of this function, the thermostat switches from follow mode to short swing mode.
The trend tracking mode uses a trend tracking mechanism similar to that in the brin belt. The short-term swing system is an open breakthrough including pattern recognition. This function compares the distance of market wandering with the actual distance of market moving:
Abs (closing price - closing price [29]) / (maximum price (30) - minimum price (30 days). * 100
This function generates a value between 0 and 100. The higher the value is, the less crowded the current market is. If the value returned by the function is less than 20, the system enters short swing mode.
Basically, most of the market is showing a swing action, and the system tries to catch the fluctuation and get a small profit from it. The thermostat tries to achieve this feat by buying / selling small market impulses. If the fluctuation is large enough, the system will switch modes.
Through an in-depth analysis of short-term volatility, we find that sometimes buying is better than selling, and vice versa. These times can be determined by a simple visual pattern. If today's closing price is higher than yesterday's high, low and closing price (also known as the key point of the day), then we think tomorrow's market action may be bearish. However, if today's closing price is lower than yesterday's average of high, low and closing price, today's market may be bullish. We classify these times as being easier to buy and sell.
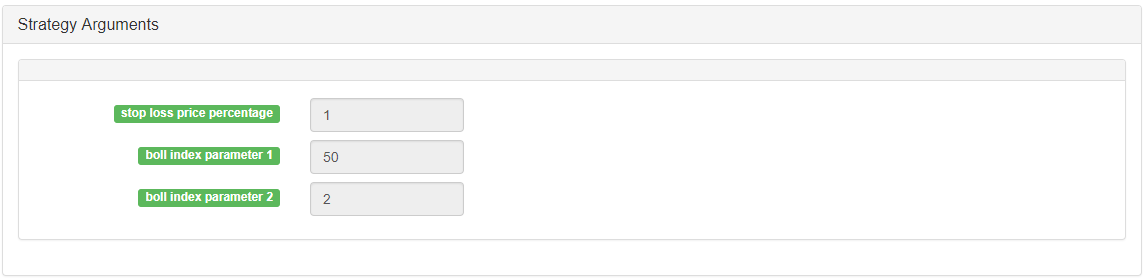
In the inventor quantification platform, the thermostat strategy is a very popular strategy. Users add some additional transaction logic according to their own needs to make the strategy perform better. The following is a typical framework of the thermostat strategy in the inventor quantification platform:
-
Main picture:
On track formula: Top ^ ^ MAC + n ﹤ tmptmp; / / on track of the brin channel
Down track formula: bottom ^ ^ mac-n ﹤ tmptmp; / / down track of the forest channel -
Sub graph:
CMI formula: CMI: ABS (c-ref (C, n ﹣ cmi-1)) / (HHV (h, n ﹣ CMI) - LLV (L, n ﹣ CMI)) * 100; / / the larger the value of 0-100, the stronger the trend, CMI < 20 shock mode, CMI > 20 is the trend -
Code (My language):
MAC:=MA(CLOSE,N);
TMP:=STD(CLOSE,N);
TOP^^MAC+N_TMP*TMP;      // Track on brin channel
BOTTOM^^MAC-N_TMP*TMP;   // Under track of brin passage
BBOLL:=C>MAC;
SBOLL:=C<MAC;
N_CMI:=30;

CMI:ABS(C-REF(C,N_CMI-1))/(HHV(H,N_CMI)-LLV(L,N_CMI))*100; //The larger the value of 0-100, the stronger the trend, CMI < 20 oscillation mode, CMI > 20 is the trend

N_KD:=9;
M1:=3;
M2:=3;
RSV:=(CLOSE-LLV(LOW,N_KD))/(HHV(HIGH,N_KD)-LLV(LOW,N_KD))*100; //The difference between the closing price and the lowest value of N cycle, the difference between the highest value of N cycle and the lowest value of N cycle, and the ratio between the two differences.

K:=SMA(RSV,M1,1); //Moving average of RSV
D:=SMA(K,M2,1);   //Moving average of K
MIND:=30;
BKD:=K>D AND D<MIND;
SKD:=K<D AND D>100-MIND;

// Oscillate Mode
BUYPK1:=CMI < 20 AND BKD;  //Concussion, multiple orders, buy even, open
SELLPK1:=CMI < 20 AND SKD; //Concussion short order sell flat open

// Dealing with the original shock position under the trend mode
SELLY1:=REF(CMI,BARSBK) < 20 AND C>BKPRICE*(1+0.01*STOPLOSS*3) AND K<D; //Shock multiple single stop
BUYY1:=REF(CMI,BARSSK) < 20 AND C<SKPRICE*(1-0.01*STOPLOSS*3) AND K>D;  //Shock single stop

// Trend mode
BUYPK2:=CMI >= 20 AND C > TOP;        // Trend multi order buy flat open
SELLPK2:=CMI >= 20 AND C < BOTTOM;    // Trend empty orders sold flat

// Dealing with the original shock position under the trend mode
SELLY2:=REF(CMI,BARSBK) >= 20 AND C>BKPRICE*(1+0.01*STOPLOSS*3) AND SBOLL;//Trend multiple single stop surplus
BUYY2:=REF(CMI,BARSSK) >= 20 AND C<SKPRICE*(1-0.01*STOPLOSS*3) AND BBOLL;//Trend empty single stop surplus
SELLS2:=REF(CMI,BARSBK) >= 20 AND C<BKPRICE*(1-0.01*STOPLOSS) AND SBOLL;//Trend multiple stop loss
BUYS2:=REF(CMI,BARSSK) >= 20 AND C>SKPRICE*(1+0.01*STOPLOSS) AND BBOLL;//Trend short order stop loss

IF BARPOS>N THEN BEGIN
    BUYPK1,BPK;
    SELLPK1,SPK;
    BUYPK2,BPK;
    SELLPK2,SPK;
END
BUYY1,BP(SKVOL);
BUYY2,BP(SKVOL);
BUYS2,BP(SKVOL);
SELLY1,SP(BKVOL);
SELLY2,SP(BKVOL);
SELLS2,SP(BKVOL);
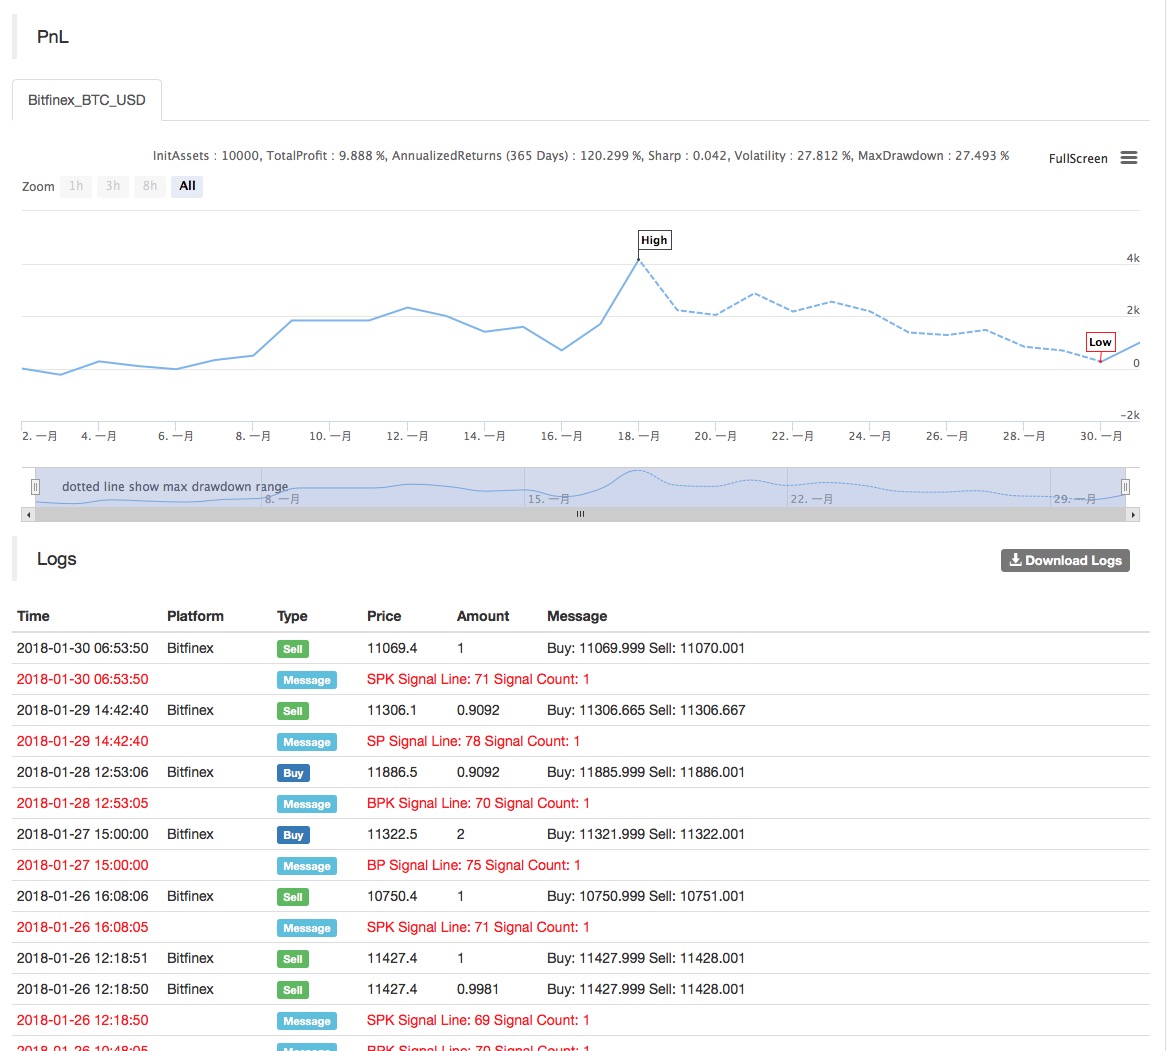
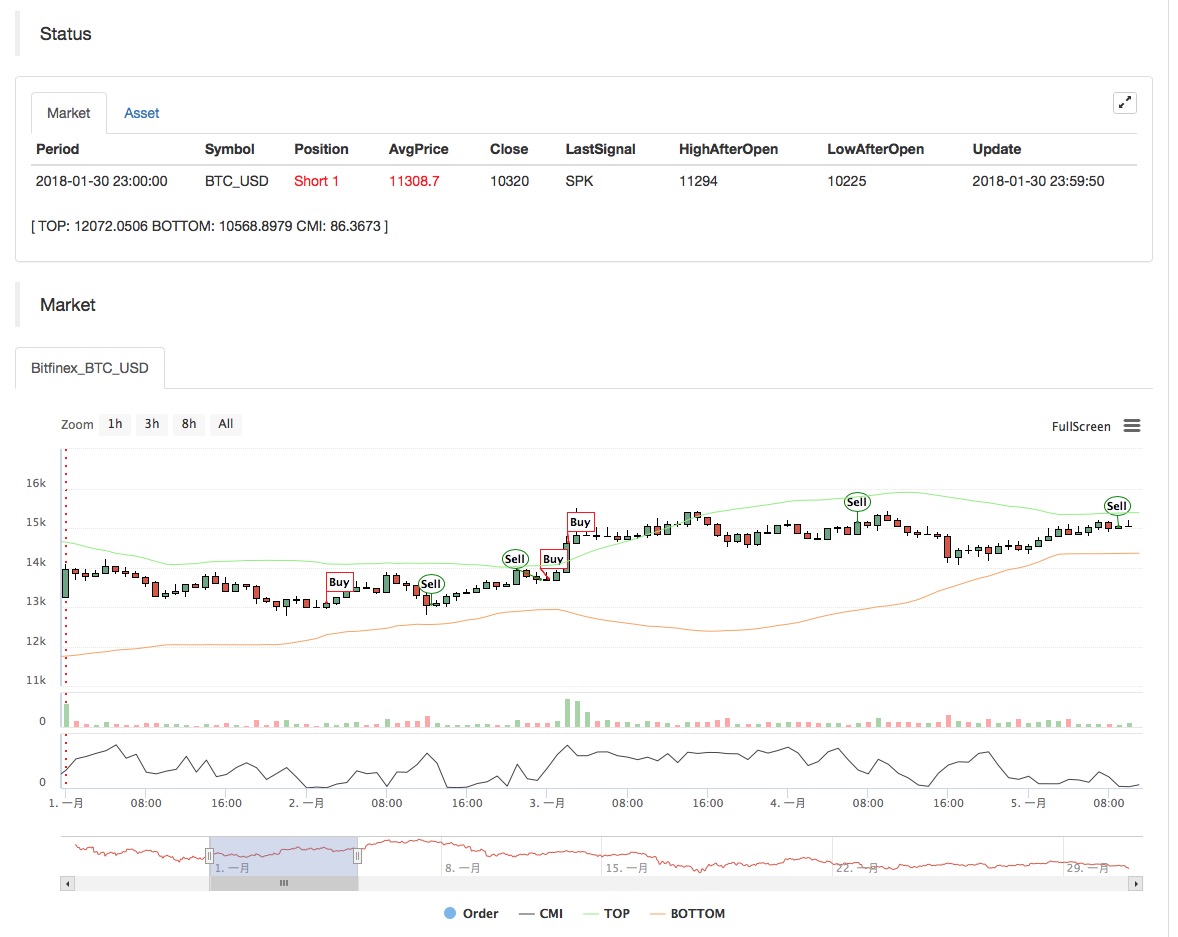
The back test results of the strategy are as follows:
For more details, see: https://www.fmz.com/strategy/129086