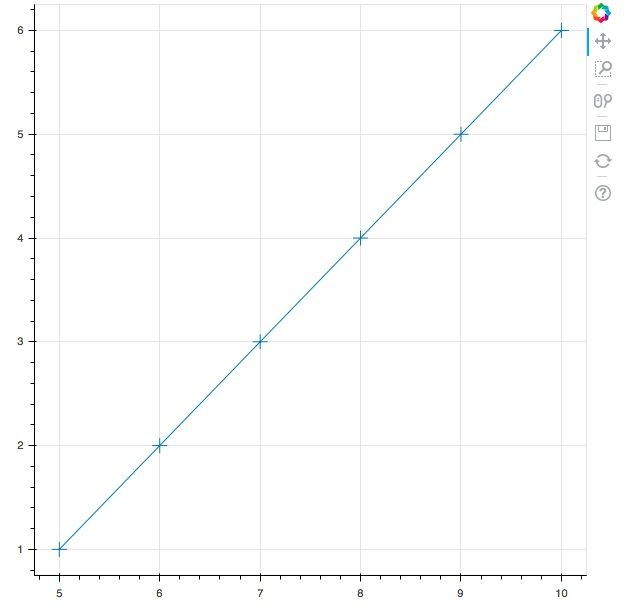
Linear graph
#Creating a line plot
#Importing the required packages

from bokeh.io import output_file, show
from bokeh.plotting import figure

#Creating our data arrays used for plotting the line plot

x = [5,6,7,8,9,10]
y = [1,2,3,4,5,6]

#Calling the figure() function to create the figure of the plot
plot = figure()

#Creating a line plot using the line() function
plot.line(x,y)

#Creating markers on our line plot at the location of the intersection between x and y
plot.cross(x,y, size = 15)

#Output the plot
output_file('line_plot.html')
show(plot)
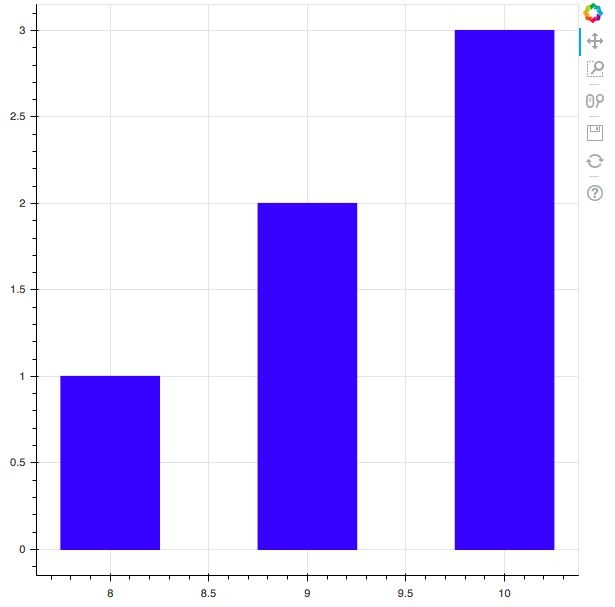
Cylindrical graph
#Creating bar plots
#Importing the required packages
from bokeh.plotting import figure, show, output_file

#Points on the x axis
x = [8,9,10]
#Points on the y axis
y = [1,2,3]

#Creating the figure of the plot
plot = figure()

#Code to create the barplot
plot.vbar(x,top = y, color = "blue", width= 0.5)

#Output the plot
output_file('barplot.html')
show(plot)
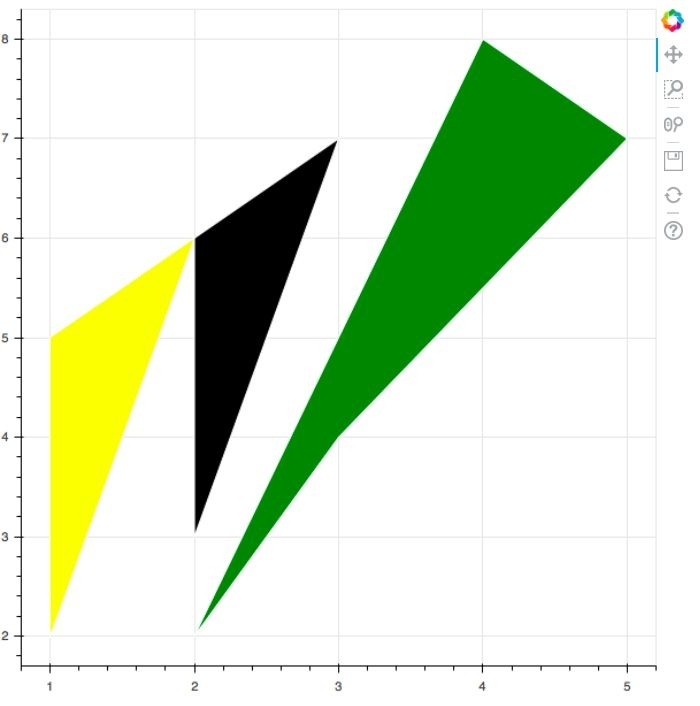
Patch map
#Creating patch plots
#Importing the required packages

from bokeh.io import output_file, show
from bokeh.plotting import figure

#Creating the regions to map
x_region = [[1,1,2,], [2,3,4], [2,3,5,4]]
y_region = [[2,5,6], [3,6,7], [2,4,7,8]]

#Creating the figure
plot = figure()

#Building the patch plot
plot.patches(x_region, y_region, fill_color = ['yellow', 'black', 'green'], line_color = 'white')

#Output the plot
output_file('patch_plot.html')

show(plot)
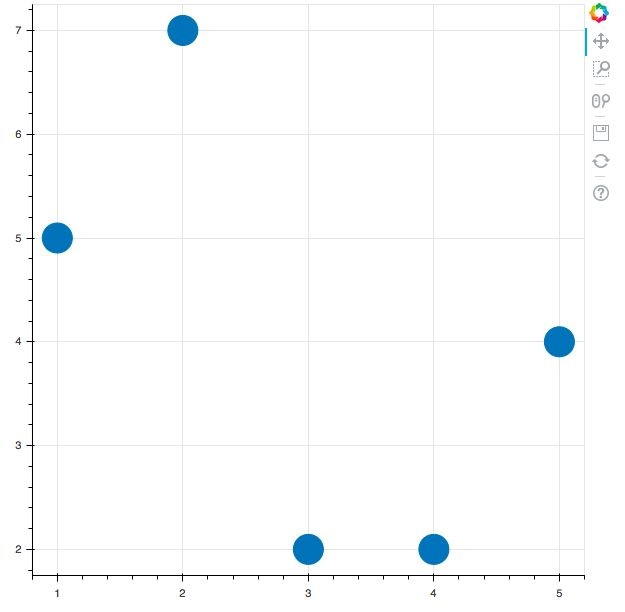
Hash diagram
#Creating scatter plots
#Importing the required packages
from bokeh.io import output_file, show
from bokeh.plotting import figure

#Creating the figure
plot = figure()

#Creating the x and y points
x = [1,2,3,4,5]
y = [5,7,2,2,4]

#Plotting the points with a cirle marker
plot.circle(x,y, size = 30)

#Output the plot
output_file('scatter.html')
show(plot)
More resources
Lovely python test development library Please like github, thank you!
Summary of python Chinese Library Documents
[Xuefeng magnetic needle stone blog] python3 standard library - Chinese version
[Xuefeng magnetite blog] python3 quick start tutorial
Interface automation performance test online training program
Automatic test data analysis of python test development
Please pay attention to more Xuefeng magnetic needle stone: a brief book
Technical support qq group: 144081101 (the group file will be recorded later) 591302926 567351477 nail free group: 21745728
Taoist technology - palmistry, hand examination, Chinese medicine and other nail groups 21734177 qq group: 391441566 184175668 338228106, hand examination, face examination, tongue examination, lottery, constitution identification. The service fee is 50 yuan per person. Please contact pin or wechat Python
#- cross()
#- x()
#- diamond()
#- diamond_cross()
#- circle_x()
#- circle_cross()
#- triangle()
#- inverted_triangle()
#- square()
#- square_x()
#- square_cross()
#- asterisk()

#Adding labels to the plot
plot.figure(x_axis_label = "Label name of x axis", y_axis_label = "Label name of y axis")

#Customizing transperancy of the plot
plot.circle(x, y, alpha = 0.5)
plot.circle(x, y, alpha = 0.5)