Author: Wang Jishun Baozun e-commerce DBA is mainly responsible for the design and development of database monitoring alarm and automation platform, and is good at database performance optimization and fault diagnosis.
background
As the number of servers in each environment of the company increases, there are multiple Prometheus clusters deployed (including production, testing, Tidb, Kubernetes, etc.). Under a certain cluster scale, the bearing capacity of common Prometheus clusters will appear short board (slow query speed, OOM, and insufficient storage space, etc.). In addition, the company needs to save the monitoring data during the double 11, double 12 and other activities to count the year-on-year monitoring reports during the activities.
SO! We need to have a unified access to view each Prometheus monitoring data, and a solution with unlimited historical data storage capacity. After POC of multiple solutions, we finally choose the Thanos solution and share it with you.
About Thanos

The main features of Thanos
-
Global view: it is seamlessly integrated with existing Prometheus settings, and can be federated across clusters and across all connected Prometheus servers. It is a good fault-tolerant routing query for Prometheus in HA.
-
Unlimited data retention: supports various object stores.
-
Compression and de standard sampling: Custom de standard sampling of historical data to greatly improve query speed.
-
To achieve high availability of various components including Prometheus.
-
Able to record rules and realize alarm.
Thanos architecture introduction
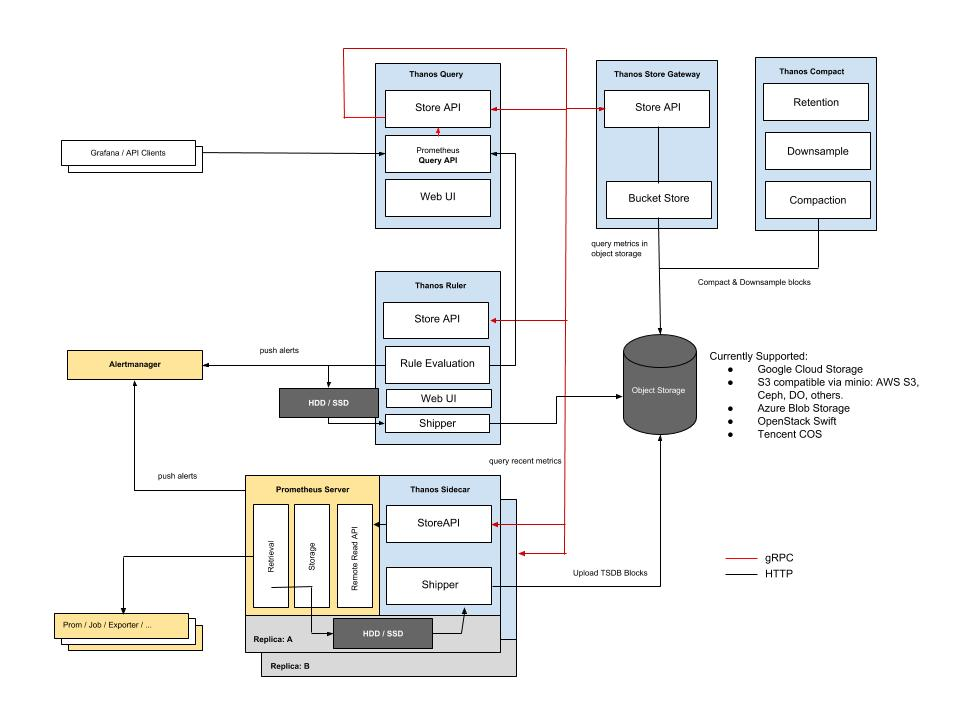
Thanos has only one binary startup file, but it is divided into multiple components according to the different variables at startup. Combined with the architecture diagram, let's introduce the functions of each component.
Sidecar
Sidecar must be deployed together with Prometheus to upload Prometheus monitoring data to object storage and allow the Querier to query Prometheus data efficiently.
Bucket
Bucket is a set of tools used to detect the Object Storage and provides a web interface to view the Blocks in the Object Storage. For Object Storage, GCS (Google cloud storage), AWS / S3, azure storage account, openstack swift, tenant cos, aliyun OSS, etc. can be selected. S3 used in this paper is deployed as Object Storage.
Store
The Store component implements the Store API on the object Store, which acts as the gateway of the object Store and synchronizes it with the object Store. Only a small amount of source data information of all blocks in the object Store is retained locally.
Querier/Query
The Querier component implements the Prometheus http v1 API, which is fully compatible with Promql query. It can connect the Store component and Sidecar component to query the required data from the object Store and Prometheus, and can query the data from any object that implements the Store API.
The Querier component is a completely stateless Querier, which can be horizontally extended to achieve high availability.
Compact
Compact components are compressors of Thanos. Responsible for compressing the data in the object storage, and also responsible for the data reduction sampling.
Example: for data over 30 days, create a 5-m-down standard sampling (the purpose of down standard sampling is not to reduce storage, but to return results faster when querying over a long time range)
Rule/Ruler
The Rule component defines the warning rules of Thanos. It can Query multiple sets of Promethus monitoring values through the Query component to achieve the effect of a single Prometheus warning threshold. Of course, there will be limitations, because rules are more likely to fail to read remote Store API objects than Prometheus in local queries. Therefore, the official suggestion is to keep the alarm rules in Promethus.
Rule component deployment is not covered in the deployment section of this article.
For more details, see:
https://thanos.io/components/rule.md/
Check
Check component to check whether the rules used by Rule component are available, similar to Promtool check rules
To configure
Binary installation package download
https://github.com/thanos-io/thanos/releases
./thanos --help
usage: thanos [<flags>] <command> [<args> ...]

A block storage based long-term storage for Prometheus

Flags:
  -h, --help               Show context-sensitive help (also try --help-long and --help-man).
      --version            Show application version.
      --log.level=info     Log filtering level.
      --log.format=logfmt  Log format to use.
      --tracing.config-file=<file-path>
                           Path to YAML file with tracing configuration. See format details:
                           https://thanos.io/tracing.md/#configuration
      --tracing.config=<content>
                           Alternative to 'tracing.config-file' flag (lower priority). Content of YAML file with tracing
                           configuration. See format details: https://thanos.io/tracing.md/#configuration

Commands:
  help [<command>...]
    Show help.

  sidecar [<flags>]
    sidecar for Prometheus server

  store [<flags>]
    store node giving access to blocks in a bucket provider. Now supported GCS, S3, Azure, Swift and Tencent COS.

  query [<flags>]
    query node exposing PromQL enabled Query API with data retrieved from multiple store nodes

  rule [<flags>]
    ruler evaluating Prometheus rules against given Query nodes, exposing Store API and storing old blocks in bucket

  compact [<flags>]
    continuously compacts blocks in an object store bucket

  bucket verify [<flags>]
    Verify all blocks in the bucket against specified issues

  bucket ls [<flags>]
    List all blocks in the bucket

  bucket inspect [<flags>]
    Inspect all blocks in the bucket in detailed, table-like way

  bucket web [<flags>]
    Web interface for remote storage bucket

  downsample [<flags>]
    continuously downsamples blocks in an object store bucket

  receive [<flags>]
    Accept Prometheus remote write API requests and write to local tsdb (EXPERIMENTAL, this may change drastically without
    notice)

  check rules <rule-files>...
    Check if the rule files are valid or not.
deploy
Sidecar
Configure Prometheus
- Change the external? labels in the configuration file prometheus.yml and reload to use them to distinguish different Prometheus clusters in Thanos.
  external_labels:
    cluster: 'test-cluster'
    monitor: "prometheus"
    replica: "A"
Start Promethus
- Keep the local Prometheus for 30 days, and add two parameters -- storage. TSDB. Min block duration = 2H -- storage. TSDB. Max block duration = 2H (the IP of Prometheus server is: 1.1.1.1.1)
./prometheus \
--config.file=/data1/deploy/conf/prometheus.yml \
--web.listen-address=:9090 \
--web.external-url=http://0.0.0.0:9090/ \
--web.enable-admin-api \
--log.level=info \
--storage.tsdb.path=/data1/deploy/prometheus2.0.0.data.metrics \
--storage.tsdb.min-block-duration=2h \
--storage.tsdb.max-block-duration=2h \
--storage.tsdb.retention=30d
Start Sidecar
./thanos sidecar \
--tsdb.path /data1/deploy/prometheus2.0.0.data.metrics \
--prometheus.url http://localhost:9090 \
--objstore.config-file bucket_config.yaml \
--shipper.upload-compacted
Bucket profile
cat bucket_config.yaml
type: S3
config:
  bucket: "bucket Name"
  endpoint: 's3 Link address for'
  access_key: "s3 Of access_key"
  insecure: true  #Whether to use the Security Protocol http or https
  signature_version2: false
  encrypt_sse: false
  secret_key: "s3 Of scret_key"
  put_user_metadata: {}
  http_config:
    idle_conn_timeout: 90s
    response_header_timeout: 2m
    insecure_skip_verify: false
  trace:
    enable: false
  part_size: 134217728
- After successful startup, Sidecar component will send all local data to S3 and new data dropped in Prometheus
Install Store,Query,Compact,Bucket
- This paper uses a single server to deploy the top four components to achieve high availability. Multiple servers can be deployed (server IP is 1.2.3.4)
Start Store
./thanos store \
--data-dir /service/thanos-0.9.0.linux-amd64/store \
--objstore.config-file bucket_config.yaml \
--http-address 0.0.0.0:19191 \
--grpc-address 0.0.0.0:19090
Start Query
./thanos query \
--http-address 0.0.0.0:19193 \
--grpc-address 0.0.0.0:19091 \
--store 1.2.3.4:19090  \ #Access Store
--store 1.1.1.1:10901    #Access Sidecar
Start Compact
./thanos compact  \
--data-dir  /service/thanos-0.9.0.linux-amd64/compact   \
--http-address  0.0.0.0:19192  \
--objstore.config-file bucket_config.yaml
So far, Thanos has been built!
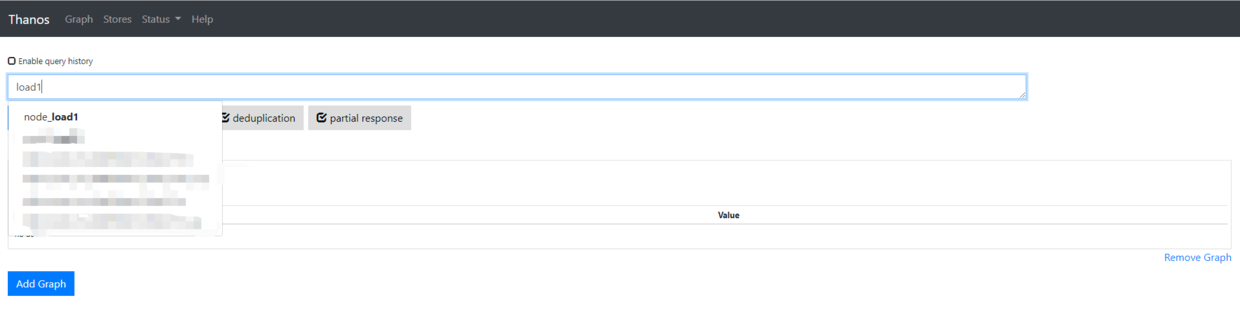
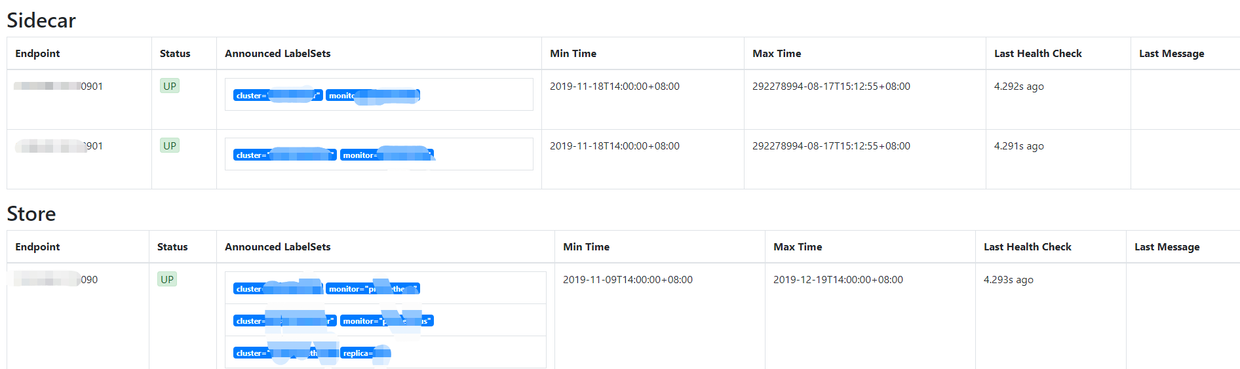
After installation, you can access:
-
It can be seen that the interface is very similar to Prometheus, fully compatible with Promql, and all historical monitoring data can be viewed through thanos web ui.
-
In the store, you can see the store and Sidecar accessed in the thanos cluster, and you can also see the information such as the maximum and minimum time of keeping monitoring data in the thanos cluster at present.
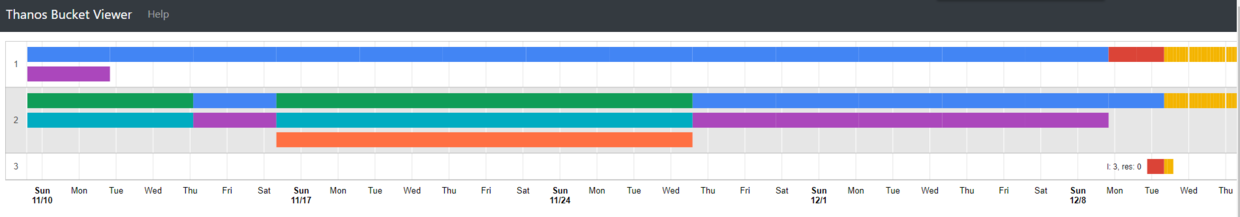
Launch Bucket web
Bucket web is an interactive web UI used to check the storage block information of objects
./thanos bucket web  \
--http-address=0.0.0.0:19194 \
--objstore.config-file bucket_config.yaml
Access after installation

More information can be obtained using. / thanos --help
Use
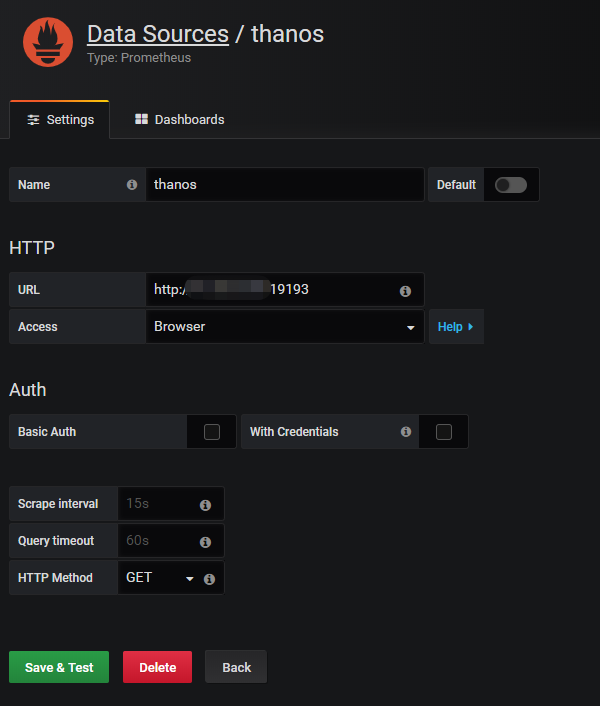
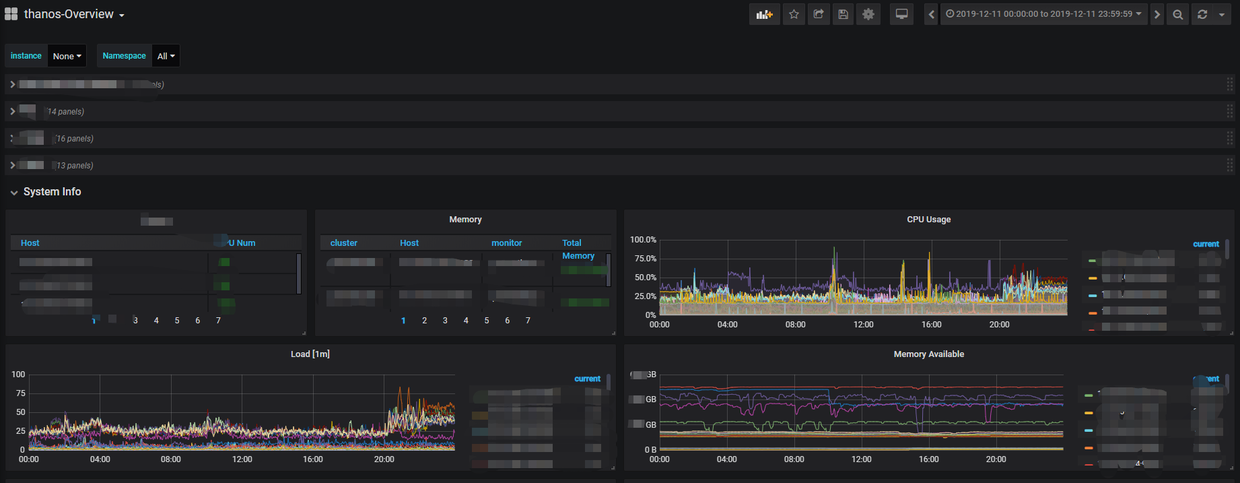
- After the construction is completed, tanos query HTTP will be connected to Grafana to realize unified access portal and aggregation of cross Prometheus clusters.
Related links
Official website: https://thanos.io