Preface
The text and pictures in this article are from the Internet. They are for study and communication only. They do not have any commercial use. The copyright is owned by the original author. If you have any questions, please contact us in time for processing.
Author: White Jade without Ice
PS: If you need Python learning materials for your child, click on the link below to get them
http://note.youdao.com/noteshare?id=3054cce4add8a909e784ad934f956cef
You don't manage your money, it doesn't matter to you!Can python help you with your finances too?
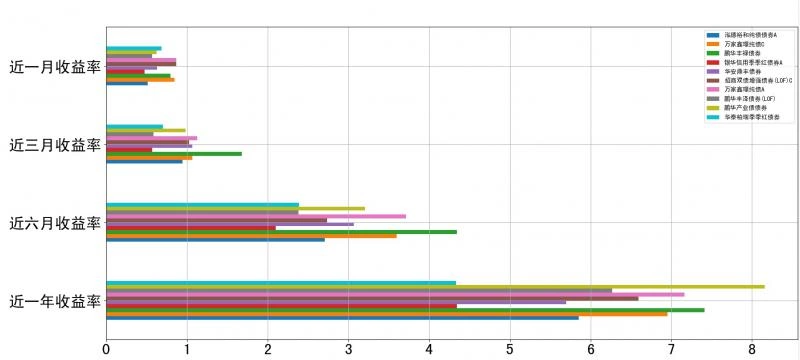
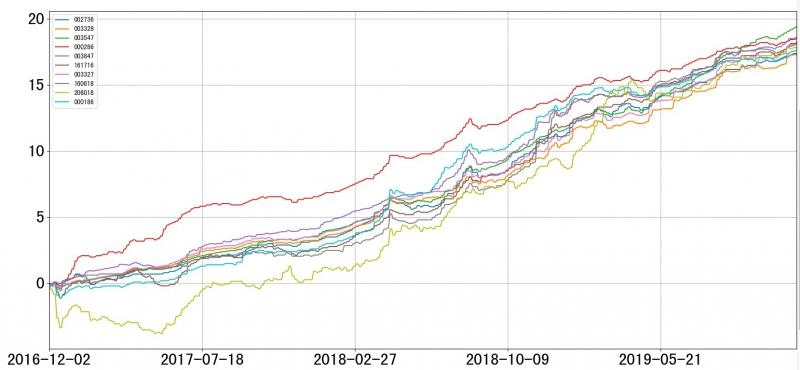
Effect Preview
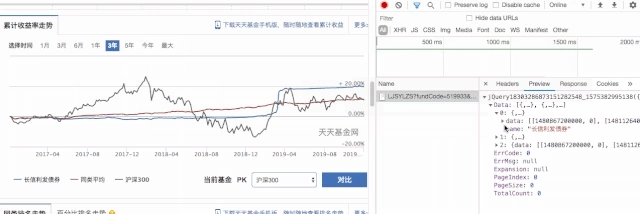
Cumulative yield trend chart
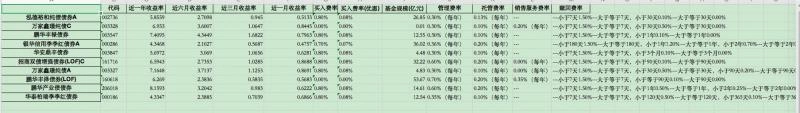
Basic Information Result
How to use:
python3 +Some third-party libraries
1 import requests
2 import pandas
3 import numpy
4 import matplotlib
5 import lxml
Configure config.json.code Configuration Fund code, whether useCache uses cache.
{
  "code":[
    "002736",
    "003328",
    "003547",
  ],
  "useCache":true
}
Run fund_analysis.py
Implementation Principle
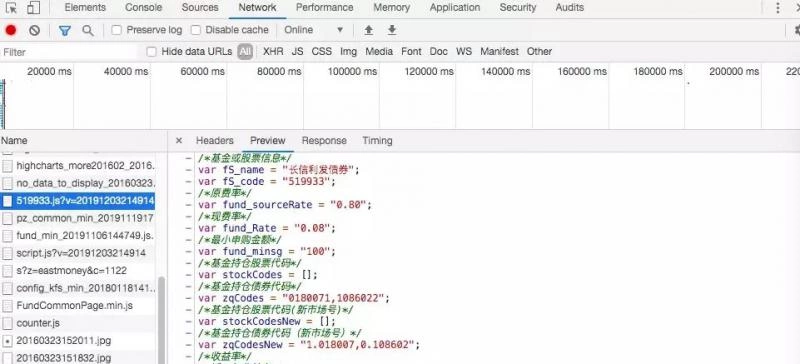
Data acquisition:
Start a fund from Tiantian Foundation and watch the loaded files in the chrome developer tools.Searching in turn finds a js file that contains some basic information about the fund.This is a js file.
Getting information about the cumulative yield requires some action on the page. Click on the 3-year cumulative yield to see how the data source was obtained by observing the developer tool request.This is json data.
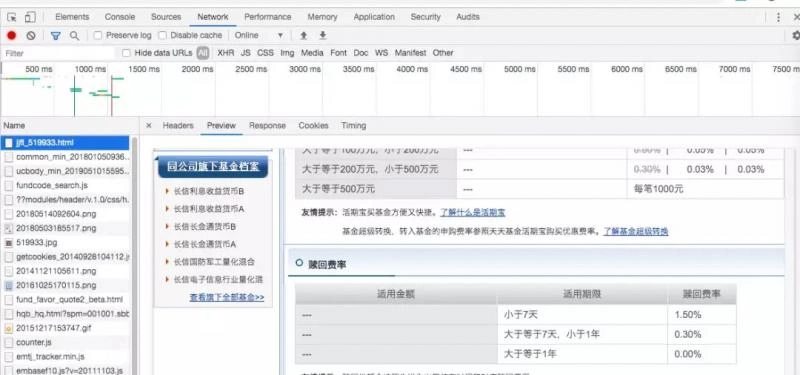
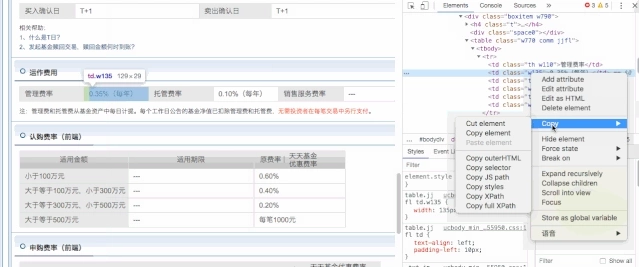
The fund rate table is on another page, so we can find the source address a few more times.This is html data.
Next, by analyzing Hearders, request simulates the browser to get data (refer to the previous article if it's not clear here).Finally, save it locally for use as a buffer.Take the cumulative yield information json as an example, the main code is as follows.
 1 filePath = f'./cache/{fundCode}.json'
 2 requests_url='http://api.fund.eastmoney.com/pinzhong/LJSYLZS'
 3 headers = {
 4   'user-agent': 'Mozilla/5.0 (Macintosh; Intel Mac OS X 10_14_4) AppleWebKit/537.36 (KHTML, like Gecko) Chrome/78.0.3904.87 Safari/537.36',
 5   'Accept': 'application/json' ,
 6   'Referer': f'http://fund.eastmoney.com/{fundCode}.html',
 7 }
 8 params={
 9     'fundCode': f'{fundCode}',
10     'indexcode': '000300',
11     'type': 'try',
12 }
13 requests_page=requests.get(requests_url,headers=headers,params=params)
14 with open(filePath, 'w') as f:
15   json.dump(requests_page.json(), f)
Data analysis:
For js files with basic information, the file is read as a string and the required data is obtained through regular expressions.
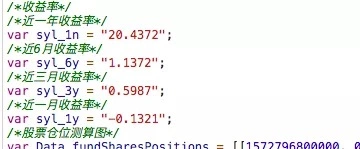
For example, a one-year return can be obtained using the following code.
syl_1n=re.search(r'syl_1n\s?=\s?"([^\s]*)"',data).group(1);
For the cumulative yield json data, we use json analysis directly to find the data needed for filtering and processing.
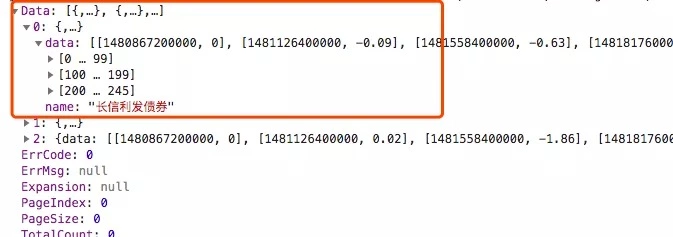
all_data is used Fund Code = The format of the cumulative yield is stored, and empty data is filled up through pandas's DataFrame.
df = DataFrame(all_data).sort_index().fillna(method='ffill')
For the html data of the fund rate table, it is parsed by xpath.The XPath path path can be obtained directly from chrome.
For administrative rates, you can refer to the following code.
1 selector = lxml.html.fromstring(data);
2 # Manage rates
3 mg_rate=selector.xpath('/html/body/div[1]/div[8]/div[3]/div[2]/div[3]/div/div[4]/div/table/tbody/tr/td[2]/text()')[0]
Data Storage:
Use plot s in the DataFrame to quickly draw and save in Excel tables using to_excel.You can refer to the following code.
 1 # Save data
 2 fig,axes = plt.subplots(2, 1)
 3 # Processing basic information
 4 df2 = DataFrame(all_data_base)
 5 df2.stack().unstack(0).to_excel(f'result_{time.time()}.xlsx',sheet_name='out')
 6 df2.iloc[1:5,:].plot.barh(ax=axes[0],grid=True,fontsize=25)
 7 # Processing income
 8 df=DataFrame(all_data).sort_index().fillna(method='ffill')
 9 df.plot(ax=axes[1],grid=True,fontsize=25)
10 fig.savefig(f'result_{time.time()}.png')
Summary
Data acquisition mainly uses the basic method of crawlers, using the requests library.Regular expressions, xpath parsing libraries, and pandas data processing libraries are used to parse and save data.
The analysis of a fund is much more than these data (such as position distribution, fund manager information, etc.). Here is just an introduction, I hope to give you a way of thinking. If you have any ideas or do not understand, please leave a message or exchange privately!