
Using Power BI to realize the visualization of real-time data is a topic that we are concerned about. The display of push data on the dashboard can be used in scenarios such as command large screen.
The content of this video is as follows: https://v.qq.com/x/page/y3030euh6do.html
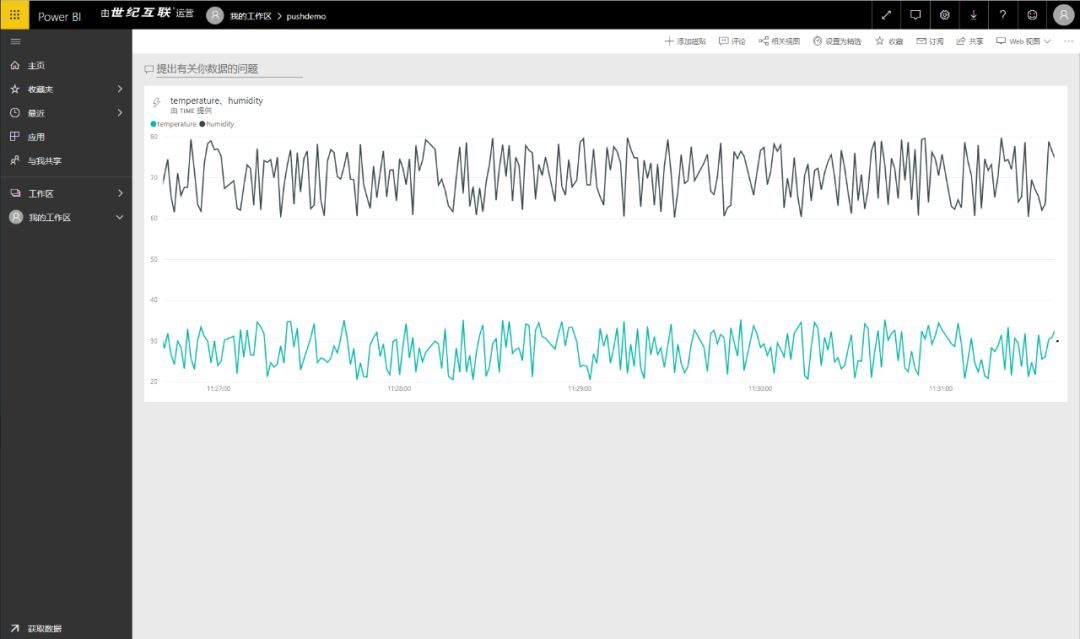
First look at the effect. The curve in the following figure will refresh automatically:
The steps are as follows:
-
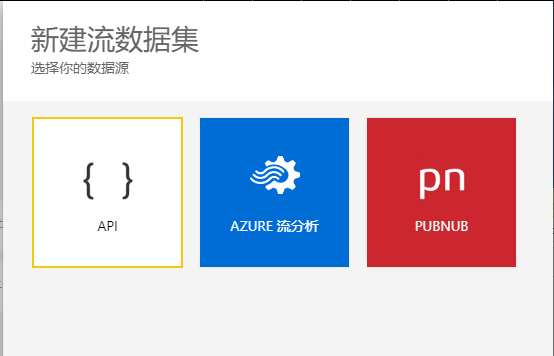
Create flow data set and select API mode
Among them, as of December 2019, Azure flow analysis in China does not support writing output directly to Power BI for the time being.
-
Fill in the dataset name and value and value type and open historical data analysis:
Historical data analysis is used to temporarily store data, which can present a curve.

-
Create a dashboard and add a live data tile to the dashboard

4. Select the created stream dataset
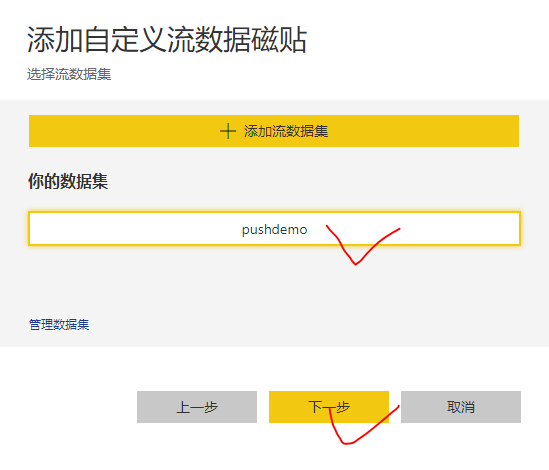
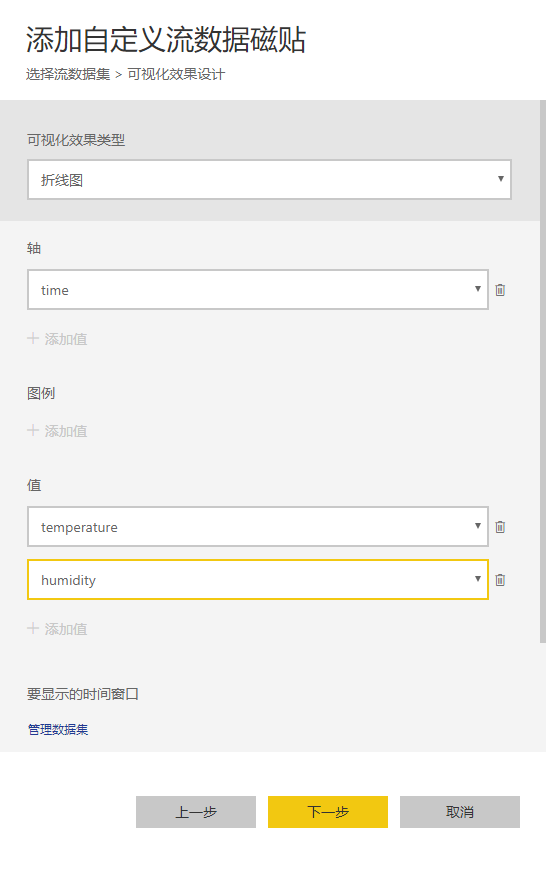
5. Add a custom stream data tile to the dashboard page
Visual effect selection line chart
Axis select time
Temperature and humidity added as "value"
6. The data can be pushed to the dataset by calling the Post request with the information shown in the following figure
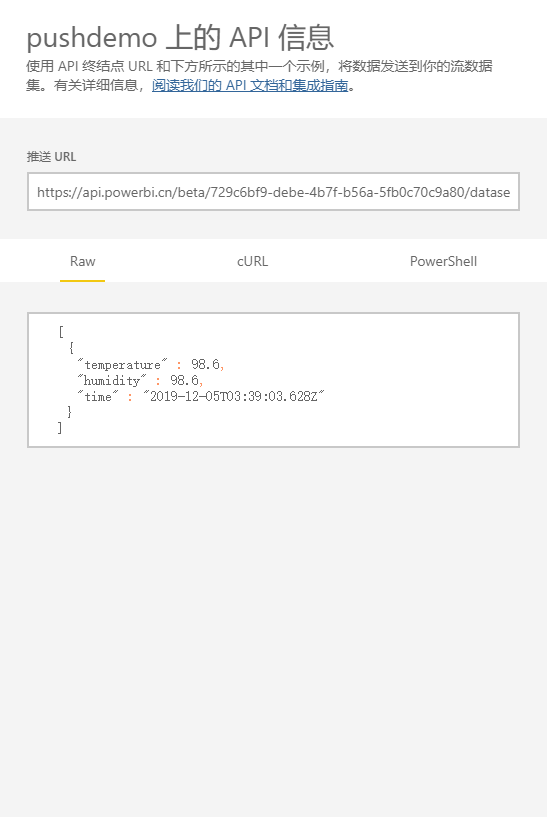
A result of 200 sent by Postman indicates successful execution.

7. Create a report on the dataset, and you can view the results pushed to the streaming dataset by POST request

8. Call the example code as follows:
using Newtonsoft.Json;using System;using System.IO;using System.Net;using System.Text;using System.Threading.Tasks;namespace pushdatatopowerbidataset{ class Program { private static int s_telemetryInterval = 1; // Seconds private static string PowerBIPushDataUrl = "https://api.powerbi.cn/beta/729c6bf9-debe-4b7f-b56a-5fb0c70c9a80/datasets/fc445a3c-9a25-4298-8188-89112874e5c3/rows?key=seAORXugMKybekrdRAxfSWM5o1MS%2F9d4pcPF9zAgblivdNXz9pRivqyVwAS%2FXMoo8wA01vuAu%2B2hBHI8gdAWMg%3D%3D"; private static void Main(string[] arg s) { Console.WriteLine("Send realtime data to power bi dataset by api. Ctrl-C to exit.\n"); SendMessageToPbiDataSetAsync(); Console.ReadLine(); } private static async void SendMessageToPbiDataSetAsync() { while (true) { // Initial telemetry values double minTemperature = 20; double minHumidity = 60; Random rand = new Random(); double currentTemperature = minTemperature + rand.NextDouble() * 15; double currentHumidity = minHumidity + rand.NextDouble() * 20; // Create JSON message var telemetryDataPoint = new { temperature = currentTemperature, humidity = currentHumidity, time=DateTime.Now }; var messageString = JsonConvert.SerializeObject(telemetryDataPoint); PostU rlAsync(PowerBIPushDataUrl, messageString); await Task.Delay(s_telemetryInterval * 1000); } } public static string PostUrlAsync(string url, string postData) { string result = ""; HttpWebReque Ion / JSON ";, byte [], data =, Encoding.UTF8.GetBytes(" ["+ - postData +"]) req.ContentLength = data.Length; using (Stream reqStream = req.GetRequestStream()) { reqStream.Write(data, 0, data.Length); reqStream.Close(); } HttpWebResponse resp = (HttpWeb {{{{{}} Console.WriteLine("OK" + "+ postData); {}}}} return result; } } }At this point, you can see the visualization of the real-time refresh on the dashboard: