Clustering is a problem that we often need to solve. Using Python - > kmeans to achieve clustering is very simple. The following is an example to show you how to simply cluster and show the clustering results. The data source of this paper is from Baidu Library: https://wenku.baidu.com/view/eb73005f9b6648d7c1c746db?from=search
There are three steps of clustering:
- Data preprocessing
- model training
- Result display
Results:
Students with similar grades were assigned to a class. Through data verification, the green area in the upper left corner is the class with the worst score. A kind of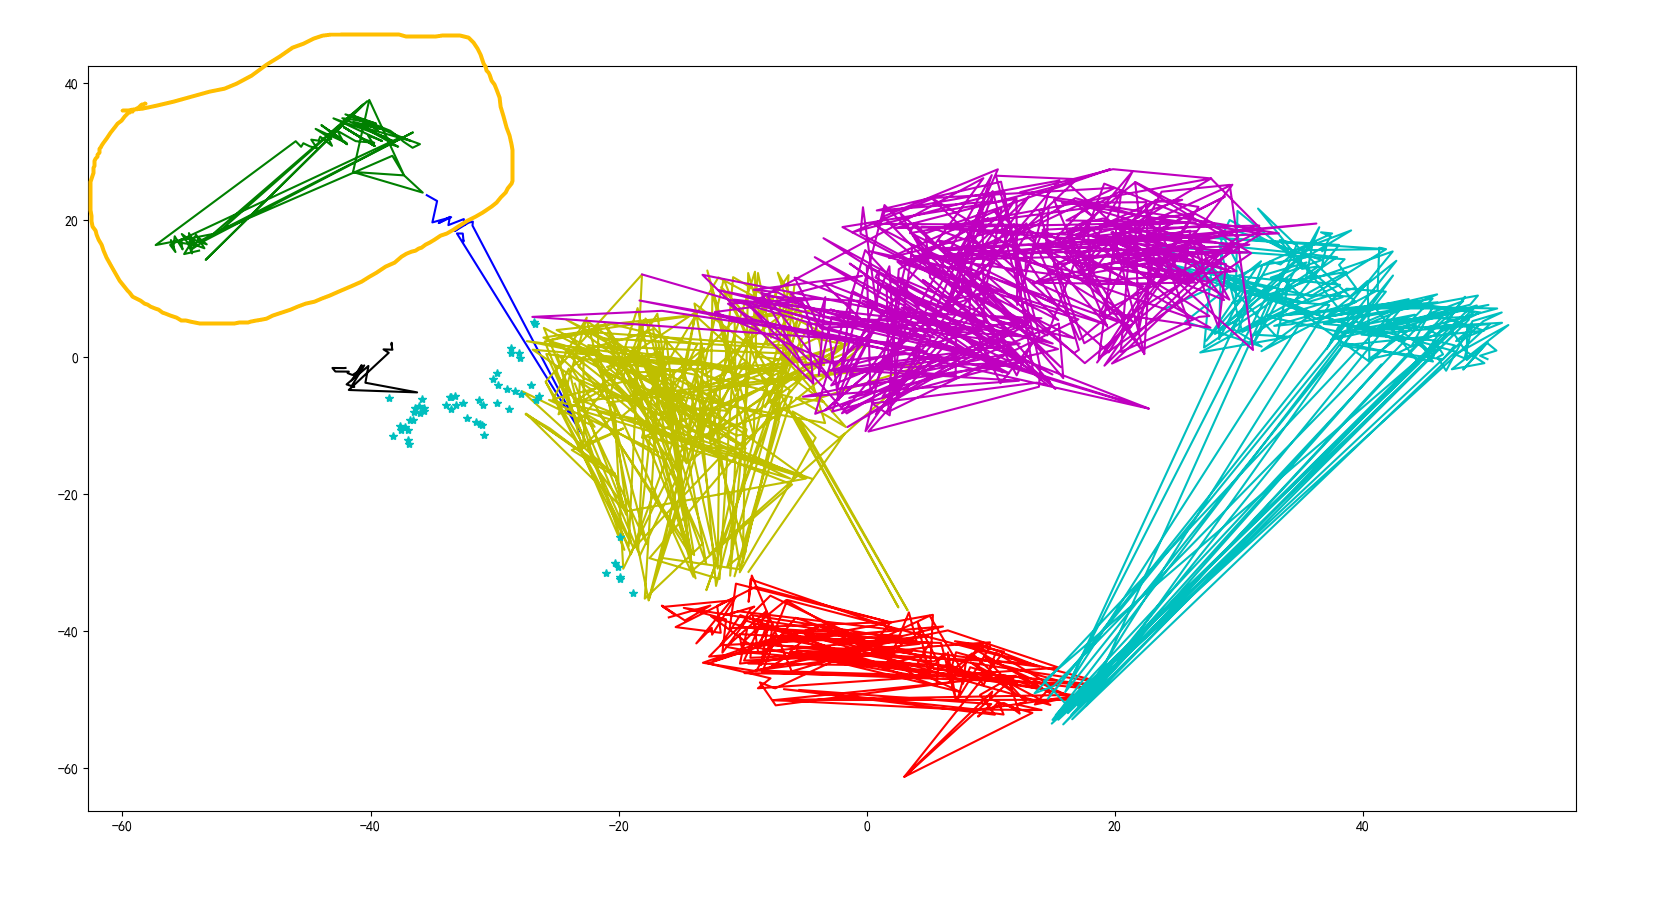
Problems:
These problems will be solved later in the exercise.
- It was hoped that students with similar experience could be divided into one class (the same class, the same examination room). However, because the data is too small, it is not recognized by the model successfully.
- It was hoped that after class division, the size of each class would be similar. But it didn't work.
Code display:
import  pandas as pd
import math
from sklearn.cluster import KMeans
from sklearn.manifold import TSNE
import matplotlib.pyplot as plt

inputfile = '.\data\EXAMSCORE.csv'
outputfile = '.\data\class_res.csv'

exam_score_data = pd.read_csv(inputfile)

# print(exam_score_data.keys())

### 1. Data preprocessing
exam_score_data = exam_score_data.drop(columns=['Seat number','Full name','comprehensive','Total score','Annual order'])

exam_score_data = exam_score_data.applymap(lambda x: 0 if math.isnan(x) else x)

print(exam_score_data[1260:1270])

### 2. Model training
k = 8 #Clustering category

iteration = 100 #Cycle times

model = KMeans(n_jobs = 5, max_iter = iteration,n_clusters=k) #Concurrent number 5

model.fit(exam_score_data) #Start clustering

r1 = pd.Series(model.labels_).value_counts() #Count the number of categories

r2 = pd.DataFrame(model.cluster_centers_) #Find the cluster center

r = pd.concat([r2, r1], axis = 1) #Horizontal connection (0 is vertical) to get the number of clusters corresponding to the cluster center

r.columns = list(exam_score_data.columns) + [u'Class number'] #Rename header

print(r)
r.to_csv(outputfile) #Save results

### 3. Result display
tsne = TSNE()
tsne.fit_transform(exam_score_data) #Data dimensionality reduction
tsne = pd.DataFrame(tsne.embedding_, index = exam_score_data.index) #Convert data format

plt.rcParams['font.sans-serif'] = ['SimHei'] #Used to display Chinese labels normally
plt.rcParams['axes.unicode_minus'] = False #Used to display negative sign normally
#Different categories drawing with different colors and styles
d = tsne[r[u'Clustering category'] == 0]
plt.plot(d[0], d[1], 'r')
d = tsne[r[u'Clustering category'] == 1]
plt.plot(d[0], d[1], 'g')
d = tsne[r[u'Clustering category'] == 2]
plt.plot(d[0], d[1], 'b')
d = tsne[r[u'Clustering category'] == 3]
plt.plot(d[0], d[1], 'y')
d = tsne[r[u'Clustering category'] == 4]
plt.plot(d[0], d[1], 'k')
d = tsne[r[u'Clustering category'] == 5]
plt.plot(d[0], d[1], 'c')
d = tsne[r[u'Clustering category'] == 6]
plt.plot(d[0], d[1], 'm')
d = tsne[r[u'Clustering category'] == 7]
plt.plot(d[0], d[1], 'c*')

plt.show()