To realize the total number display function in the middle of pie chart, version: "eckarts": "^ 4.2.1"
In this method, title is used to display the total number, but there is a bug that the content is highlighted but not displayed. The specific situation is as follows
Code part
InitroundPie () {
      this.chart = echarts.init(this.$refs[this.bindRef])
      let _data = [ // Current death
        { value: 120, name: 'On-line' },
        { value: 120, name: 'Off-line' },
        { value: 160, name: 'not active' }
      ]

      let options = {
        title: {
          show: true,
          text: 'whole', // Current death
          subtext: '400', // Current death
          top: 95,
          left: 115,
          textAlign: 'center',
          textStyle: {
            fontSize: '14',
            fontWeight: 'bold'
          },
          subtextStyle: {
            fontSize: '20',
            fontWeight: 'bold'
          }
        },
        tooltip: {
          show: false,
          trigger: 'item',
          formatter: '{a} <br/>{b}: {c} ({d}%)'
        },
        legend: {
          orient: 'vertical',
          x: 'right',
          data: ['On-line', 'Off-line', 'not active'],
          selectedMode: false,
          top: 40,
          formatter: function (name) {
            let legenTile = name + ': '
            for (let item of _data) {
              if (name === item.name) legenTile += item.value
            }
            return legenTile
          }
        },
        series: [
          {
            name: 'from',
            type: 'pie',
            radius: ['50%', '70%'],
            avoidLabelOverlap: false,
            hoverAnimation: false,
            textAlign: 'center',
            center: [120, 120],
            label: {
              normal: {
                show: false,
                position: 'center',
                formatter: '{b}\n{c}',
                align: 'center',
                verticalAlign: 'middle'
              },
              emphasis: {
                show: true,
                textStyle: {
                  fontSize: '20',
                  fontWeight: 'bold'
                }
              }
            },
            labelLine: {
              normal: {
                show: false
              }
            },
            data: _data
          }
        ]
      }

      this.chart.setOption(options)

      this.chart.on('mouseover', { seriesName: 'from' }, () => {
        this.chart.setOption({
          title: {
            show: false
          }
        })
      })

      this.chart.on('mouseout', { seriesName: 'from' }, () => {
        this.chart.setOption({
          title: {
            show: true
          }
        })
      })
    },
Method logic: hide the title when the mouse moves in and display the title when it moves out. The effect of this method is as follows: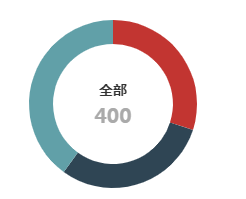
The display effect is normal, but when the mouse hovers over the data, title.show:false, the original emphasis event fails, as follows: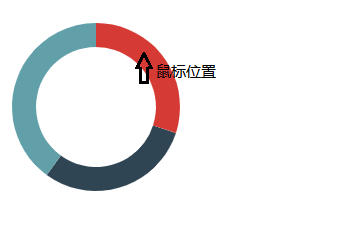
Using the dispatchAction event to trigger actively can not trigger the current selection, but it can trigger other selections, which is solved by using other methods.
The code is as follows:
InitroundPie () {
      this.chart = echarts.init(this.$refs[this.bindRef])

      let _data = [
        { value: 120, name: 'On-line' },
        { value: 120, name: 'Off-line' },
        { value: 160, name: 'not active' }
      ]

      let options = {
        title: {
          show: true,
          text: 'whole',
          subtext: '400',
          top: 95,
          left: 115,
          textAlign: 'center',
          z: 0,
          textStyle: {
            fontSize: '14',
            fontWeight: 'bold'
          },
          subtextStyle: {
            fontSize: '20',
            fontWeight: 'bold'
          }
        },
        tooltip: {
          show: false,
          trigger: 'item',
          alwaysShowContent: true,
          formatter: '{a} <br/>{b}: {c} ({d}%)'
        },
        legend: {
          orient: 'vertical',
          x: 'right',
          data: ['On-line', 'Off-line', 'not active'],
          selectedMode: false,
          top: 40,
          formatter: function (name) {
            let legenTile = name + ': '
            for (let item of _data) {
              if (name === item.name) legenTile += item.value
            }
            return legenTile
          }
        },
        series: [
          {
            name: 'from',
            type: 'pie',
            radius: ['50%', '70%'],
            avoidLabelOverlap: false,
            hoverAnimation: false,
            textAlign: 'center',
            center: [120, 120],
            label: {
              normal: {
              	// Focus here, set to show
                show: true,
                position: 'center',
                formatter: '{b}\n{c}',
                align: 'center',
                verticalAlign: 'middle',
                // Focus here, font size set to 0
                textStyle: {
                  fontSize: '0'
                }
              },
              emphasis: {
                show: true,
                textStyle: {
                  fontSize: '20',
                  fontWeight: 'bold'
                },
                // Synchronous style
                formatter: function (params) {
                  return `{tTitle|${params.name}}\n{tSubTitle|${params.value}}`
                },
                rich: {
                  tTitle: {
                    fontSize: '14',
                    fontWeight: 'bold',
                    lineHeight: '25'
                  },
                  tSubTitle: {
                    fontSize: '20',
                    fontWeight: 'bold',
                    lineHeight: '25'
                  }
                }
              }
            },
            labelLine: {
              normal: {
                show: false
              }
            },
            data: _data
          }
        ]
      }

      this.chart.setOption(options)

      this.chart.on('mouseover', { seriesName: 'from' }, params => {
        this.chart.setOption({
          title: {
            show: false
          }
        })
      })

      this.chart.on('mouseout', { seriesName: 'from' }, params => {
        this.chart.setOption({
          title: {
            show: true
          }
        })
      })
    }
After the change, the display effect is as follows: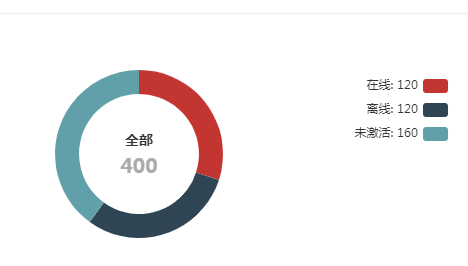
Mouse hover highlight effect: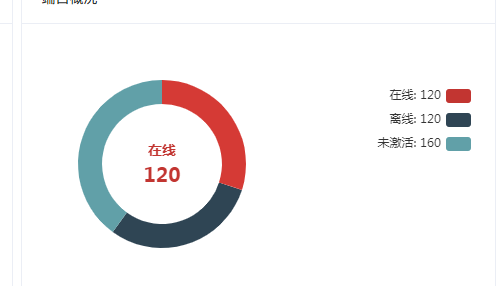
Completed the expected effect, display the total number, move the mouse to display the currently selected data, and the display position is in the middle.