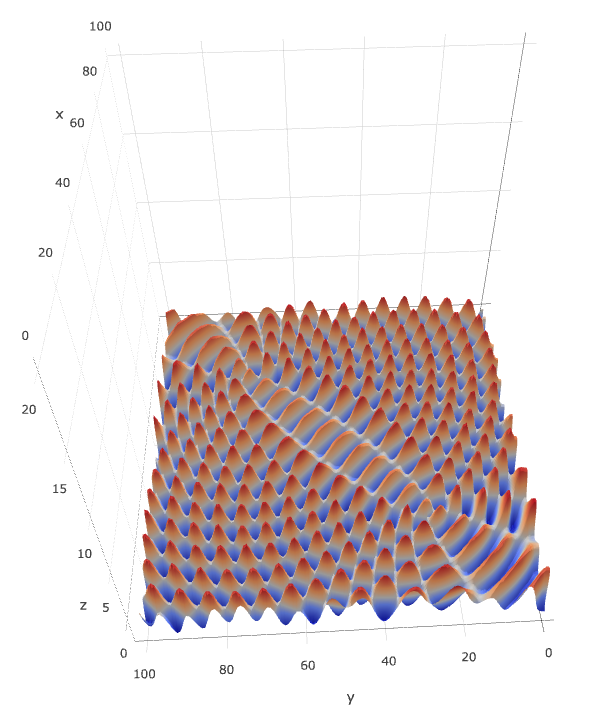
After learning how to make two-dimensional Contour Plots of two wave source interference phenomenon, I found that plot also has three-dimensional image making, that is, 3D Surface Plots, which can better show the results of two wave source interference phenomenon, as expected. Some places in the middle should be explained. The default bottom of the 3D Surface Plots chart is a square, so I used a 100 * 100 interferogram, and then added a layer of transparent icons to flatten the image. Otherwise, the upper and lower limits of the icons are wave positions, which looks very unsightly.
Share the code and results below:
Here is the code of python:
#!/usr/bin/python
# coding=utf-8

import plotly.plotly

z = []
with open("/Users/Vicky/Documents/workspace/fission/long/intervene.log") as apidata:
    for i in apidata:
        data = i.split("\n")[0].split(",")
        z.append(data)
matrix = [[20 for zij in zi] for zi in z]#In order to flatten the stereogram
plotly.offline.plot([
     dict(
            z=z,
            type="surface"
    ),
    dict(
            z=matrix,
            showscale=False,
            opacity=0.01,#transparency
            type="surface"
    )
], filename="2222.html")
Here is the java part of the code to generate data:
package practise;

import java.awt.Point;
import java.util.ArrayList;
import java.util.List;
import source.SourceCode;

public class Intervene extends SourceCode {
	public List<List<Double>> data = new ArrayList<>();

	public static void main(String[] args) {
		Intervene intervene = new Intervene();
		intervene.testDemo001();
	}

	public void testDemo001() {
		Point point1 = new Point(25, 25);
		Point point2 = new Point(75, 75);
		int lamda = 6;
		for (int i = 0; i < 100; i++) {// y axis
			List<Double> distance = new ArrayList<>();
			for (int j = 0; j < 100; j++) {// x axis
				Point point = new Point(j, i);
				double x = point.distance(point1) % lamda / lamda;
				double y = point.distance(point2) % lamda / lamda;
				double xx = Math.sin(x * 2 * Math.PI);
				double yy = Math.sin(y * 2 * Math.PI);
				distance.add(xx + yy);
			}
			data.add(distance);
		}
		StringBuffer content = new StringBuffer();
		int size = data.size();
		for (int i = 0; i < size; i++) {
			String text = data.get(i).toString();
			text = text.substring(1, text.length() - 1);
			if (i == 0)
				content.append(text);
			content.append(LINE + text);
		}
		logLong("intervene.log", content.toString());
	}
}
Here is a screenshot of the 3D Surface Plots:

Selected technical articles
- java one line code printing heart
- Chinese version of Linux performance monitoring software netdata
- Interface test code coverage (jacoco) scheme sharing
- Performance testing framework
- How to test the performance of Linux command line interface happily
- Diagram HTTP brain map
- Automatically turn a swagger document into test code
- Five line code to build static blog
- Research on the testing framework of linear interface based on java
- Single sign on performance test scheme
Selected non-technical articles
- Why choose software testing as a career path?
- Programming thinking for all
- Barriers to automated testing
- The problem with automated testing
- Seven steps to become an excellent automation test engineer
- The new trend of software testing in the next 10 years
- The new trend of software testing in the next 10 years
- Important reasons for manual testing
Great coffee style
- Cloud test platform -- integrator
- Android App testing tools and knowledge collection
- 4399AT UI automation CI and CD
- Android App general test content
- JVM objects and heap