Preface
Charts are often used for data analysis in projects. There are many excellent open source galleries for charts on gitHub. Today, we share the bar charts in MPAndroid Chart. A brief introduction to MPAndroid Chart: It can realize the drag of charts, 3D, partial view, dynamic display of data and other functions.
Official source address: github.com/PhilJay/MPA...
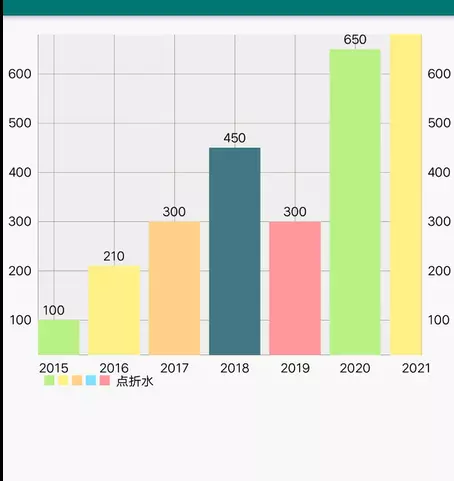
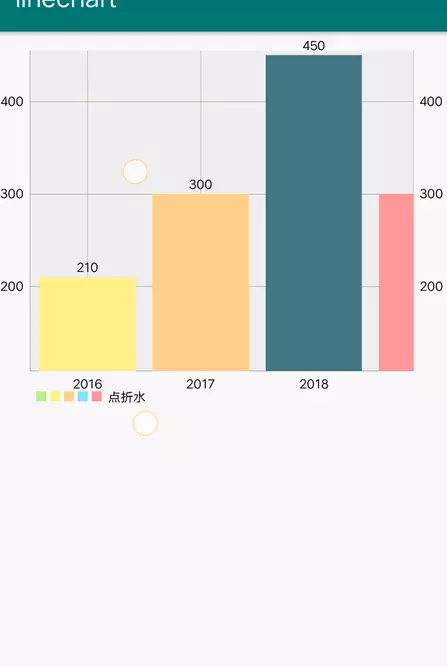
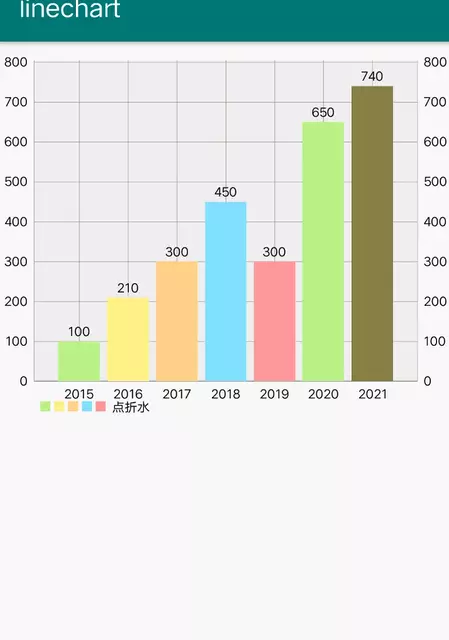
No more nonsense. Let's see the effect first.
Operation steps
Step 1: You need to add dependent libraries to your project
implementation 'com.github.PhilJay:MPAndroidChart:v3.1.0-alpha'
implementation 'com.google.android.material:material:1.0.0'
Step 2: In xml
   <com.github.mikephil.charting.charts.BarChart
    android:id="@+id/chart1"
    android:layout_width="match_parent"
    android:layout_height="300dp"
    />
Step 3: ValueFormatter.java
  /**
 * Class to format all values before they are drawn as labels.
 */
 public abstract class ValueFormatter implements IAxisValueFormatter, IValueFormatter {/**
 * <b>DO NOT USE</b>, only for backwards compatibility and will be removed in future versions.
 *
 * @param value the value to be formatted
 * @param axis  the axis the value belongs to
 * @return formatted string label
 */@Override@Deprecatedpublic String getFormattedValue(float value, AxisBase axis) {    return getFormattedValue(value);
}/**
 * <b>DO NOT USE</b>, only for backwards compatibility and will be removed in future versions.
 * @param value           the value to be formatted
 * @param entry           the entry the value belongs to - in e.g. BarChart, this is of class BarEntry
 * @param dataSetIndex    the index of the DataSet the entry in focus belongs to
 * @param viewPortHandler provides information about the current chart state (scale, translation, ...)
 * @return formatted string label
 */@Override@Deprecatedpublic String getFormattedValue(float value, Entry entry, int dataSetIndex, ViewPortHandler viewPortHandler) {    return getFormattedValue(value);
}/**
 * Called when drawing any label, used to change numbers into formatted strings.
 *
 * @param value float to be formatted
 * @return formatted string label
 */public String getFormattedValue(float value) {    return String.valueOf(value);
}/**
 * Used to draw axis labels, calls {@link #getFormattedValue(float)} by default.
 *
 * @param value float to be formatted
 * @param axis  axis being labeled
 * @return formatted string label
 */public String getAxisLabel(float value, AxisBase axis) {    return getFormattedValue(value);
}/**
 * Used to draw bar labels, calls {@link #getFormattedValue(float)} by default.
 *
 * @param barEntry bar being labeled
 * @return formatted string label
 */public String getBarLabel(BarEntry barEntry) {    return getFormattedValue(barEntry.getY());
}/**
 * Used to draw stacked bar labels, calls {@link #getFormattedValue(float)} by default.
 *
 * @param value        current value to be formatted
 * @param stackedEntry stacked entry being labeled, contains all Y values
 * @return formatted string label
 */public String getBarStackedLabel(float value, BarEntry stackedEntry) {    return getFormattedValue(value);
}/**
 * Used to draw line and scatter labels, calls {@link #getFormattedValue(float)} by default.
 *
 * @param entry point being labeled, contains X value
 * @return formatted string label
 */public String getPointLabel(Entry entry) {    return getFormattedValue(entry.getY());
}/**
 * Used to draw pie value labels, calls {@link #getFormattedValue(float)} by default.
 *
 * @param value    float to be formatted, may have been converted to percentage
 * @param pieEntry slice being labeled, contains original, non-percentage Y value
 * @return formatted string label
 */public String getPieLabel(float value, PieEntry pieEntry) {    return getFormattedValue(value);
}/**
 * Used to draw radar value labels, calls {@link #getFormattedValue(float)} by default.
 *
 * @param radarEntry entry being labeled
 * @return formatted string label
 */public String getRadarLabel(RadarEntry radarEntry) {    return getFormattedValue(radarEntry.getY());
}/**
 * Used to draw bubble size labels, calls {@link #getFormattedValue(float)} by default.
 *
 * @param bubbleEntry bubble being labeled, also contains X and Y values
 * @return formatted string label
 */public String getBubbleLabel(BubbleEntry bubbleEntry) {    return getFormattedValue(bubbleEntry.getSize());
}/**
 * Used to draw high labels, calls {@link #getFormattedValue(float)} by default.
 *
 * @param candleEntry candlestick being labeled
 * @return formatted string label
 */public String getCandleLabel(CandleEntry candleEntry) {    return getFormattedValue(candleEntry.getHigh());
}

}
Step 4: MyValue Formatter
    public class MyValueFormatter extends ValueFormatter{private final DecimalFormat mFormat;private String suffix;public MyValueFormatter(String suffix) {
    mFormat = new DecimalFormat("0000");    this.suffix = suffix;
}@Overridepublic String getFormattedValue(float value) {    return mFormat.format(value) + suffix;
}@Overridepublic String getAxisLabel(float value, AxisBase axis) {    if (axis instanceof XAxis) {        return mFormat.format(value);
    } else if (value > 0) {        return mFormat.format(value) + suffix;
    } else {        return mFormat.format(value);
    }
}
}
//Copy code
Step 5: Main Acyivity
  package detongs.hbqianze.him.linechart;  import android.os.Bundle;  import android.util.Log;  import android.view.WindowManager;  import android.widget.TextView;  import androidx.appcompat.app.AppCompatActivity;  import com.github.mikephil.charting.charts.BarChart;  import com.github.mikephil.charting.components.XAxis;  import com.github.mikephil.charting.components.YAxis;  import com.github.mikephil.charting.data.BarData;  import com.github.mikephil.charting.data.BarDataSet;  import com.github.mikephil.charting.data.BarEntry;  import com.github.mikephil.charting.interfaces.datasets.IBarDataSet;  import  com.github.mikephil.charting.interfaces.datasets.IDataSet;  import com.github.mikephil.charting.utils.ColorTemplate;  import java.util.ArrayList;  import detongs.hbqianze.him.linechart.chart.MyValueFormatter;  import detongs.hbqianze.him.linechart.chart.ValueFormatter;  public class MainActivity extends AppCompatActivity {private BarChart chart;private TextView te_cache;@Overrideprotected void onCreate(Bundle savedInstanceState) {    super.onCreate(savedInstanceState);
    getWindow().setFlags(WindowManager.LayoutParams.FLAG_FULLSCREEN,
            WindowManager.LayoutParams.FLAG_FULLSCREEN);
    setContentView(R.layout.activity_main);

    chart = findViewById(R.id.chart1);
    te_cache = findViewById(R.id.te_cache);

    chart.getDescription().setEnabled(false);    //Set the maximum entry, no value beyond
    chart.setMaxVisibleValueCount(60);    //Zoom on x-axis and y-axis, respectively
    chart.setPinchZoom(true);    //Setting Shadows for Residual Statistical Charts
    chart.setDrawBarShadow(false);    //Setting up grid layout
    chart.setDrawGridBackground(true);    //2,015 Separator bug by customizing an x-axis label
    ValueFormatter custom = new MyValueFormatter(" ");    //Get the x-axis
    XAxis xAxis = chart.getXAxis();    //Set the display position of the x-axis
    xAxis.setPosition(XAxis.XAxisPosition.BOTTOM);    //Setting up grid layout
    xAxis.setDrawGridLines(true);    //Charts will avoid the first and last label entries being subtracted from the edges of a chart or screen
    xAxis.setAvoidFirstLastClipping(false);    //Draw labels. Refer to the corresponding values on the x-axis. Default true
    xAxis.setDrawLabels(true);
    xAxis.setValueFormatter(custom);    //The problem of x-axis data overlap after scaling
    xAxis.setGranularityEnabled(true);    //Get the y tag on the right
    YAxis axisRight = chart.getAxisRight();
    axisRight.setStartAtZero(true);    //Get the label on the left y-axis
    YAxis axisLeft = chart.getAxisLeft();    //Set Y-axis values from zero
    axisLeft.setStartAtZero(true);

    chart.getAxisLeft().setDrawGridLines(false);    //Setting Animation Time
     chart.animateXY(600,600);

     chart.getLegend().setEnabled(true);

    getData();    //Set the values on the column chart
    chart.getData().setValueTextSize(10);    for (IDataSet set : chart.getData().getDataSets()){
        set.setDrawValues(!set.isDrawValuesEnabled());
    }

}public void getData(){
ArrayList<BarEntry> values = new ArrayList<>();
    Float aFloat = Float.valueOf("2015");
    Log.v("xue","aFloat+++++"+aFloat);
    BarEntry barEntry = new BarEntry(aFloat,Float.valueOf("100"));
BarEntry barEntry1 = new BarEntry(Float.valueOf("2016"),Float.valueOf("210"));
BarEntry barEntry2 = new BarEntry(Float.valueOf("2017"),Float.valueOf("300"));
BarEntry barEntry3 = new BarEntry(Float.valueOf("2018"),Float.valueOf("450"));
BarEntry barEntry4 = new BarEntry(Float.valueOf("2019"),Float.valueOf("300"));
    BarEntry barEntry5 = new BarEntry(Float.valueOf("2020"),Float.valueOf("650"));
    BarEntry barEntry6 = new BarEntry(Float.valueOf("2021"),Float.valueOf("740"));
values.add(barEntry);
values.add(barEntry1);
values.add(barEntry2);
values.add(barEntry3);
values.add(barEntry4);
values.add(barEntry5);
    values.add(barEntry6);
BarDataSet set1;if (chart.getData() != null &&
        chart.getData().getDataSetCount() > 0) {
    set1 = (BarDataSet) chart.getData().getDataSetByIndex(0);
    set1.setValues(values);
    chart.getData().notifyDataChanged();
    chart.notifyDataSetChanged();
} else {
    set1 = new BarDataSet(values, "Point folding water");
    set1.setColors(ColorTemplate.VORDIPLOM_COLORS);
    set1.setDrawValues(false);

    ArrayList<IBarDataSet> dataSets = new ArrayList<>();
    dataSets.add(set1);

    BarData data = new BarData(dataSets);
    chart.setData(data);

    chart.setFitBars(true);
}    //Draw chart.invalidate();

}

}
Last
This is the end of the article. If you think it's well written, pay attention to it. Your support is my greatest motivation! If there are other partners who want to know about other attributes of MPAndroidChart, they can also leave a message for me.