scene
Winform implements multiple Y-axis of ZedGraph (with source download):
https://blog.csdn.net/BADAO_LIUMANG_QIZHI/article/details/100132245
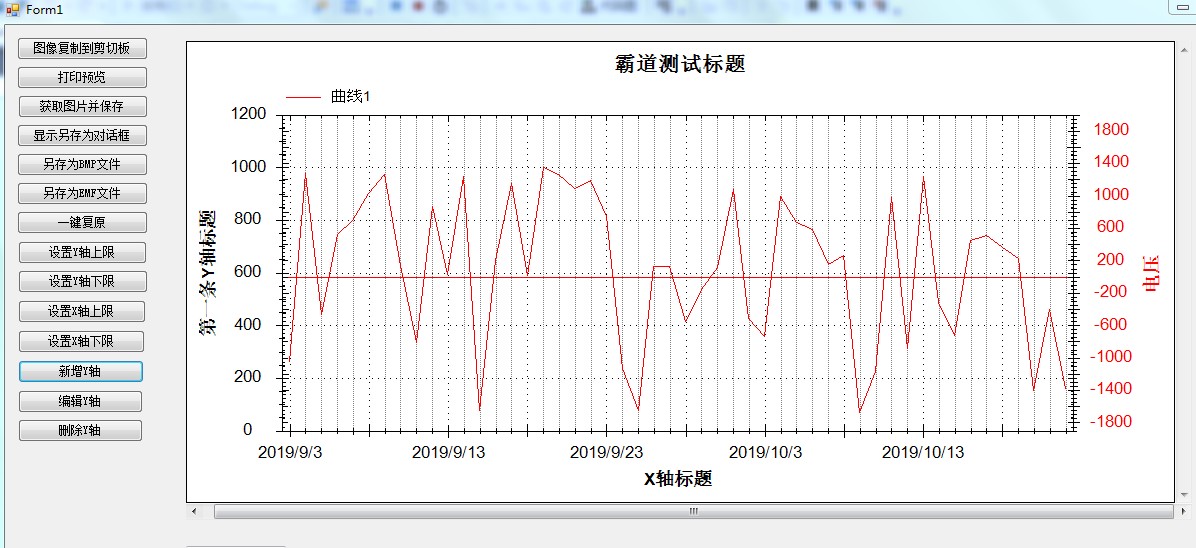
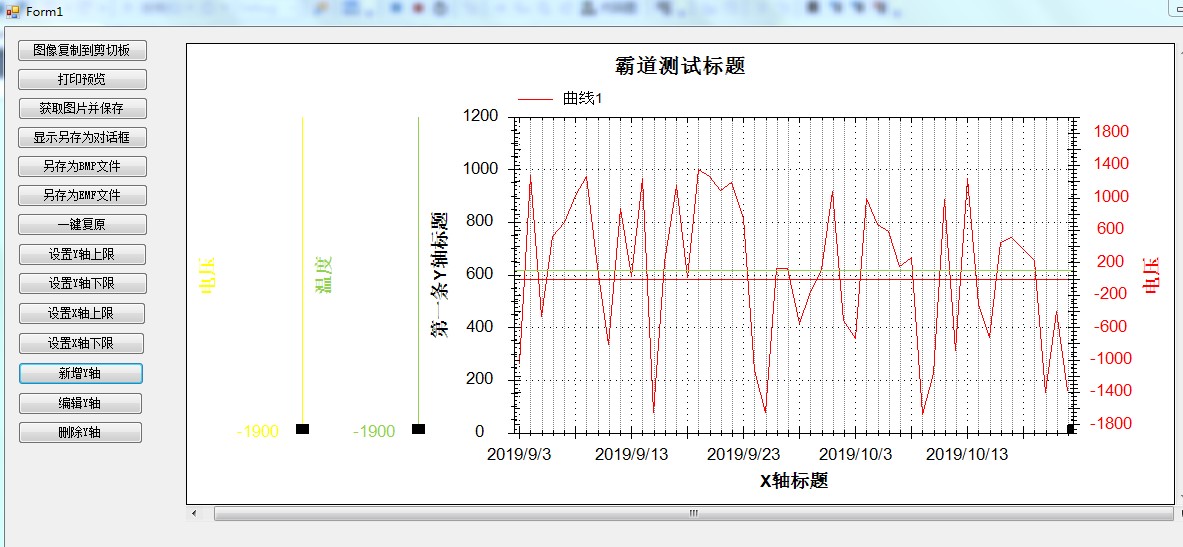
On the effect of displaying multiple self-defined Y-axis, the new function of self-defined Y-axis is improved.
Focus on the Public Number
A hegemonic programmed ape
Get programming related e-books, tutorials and free downloads.
Sample Code Download
https://download.csdn.net/download/badao_liumang_qizhi/11653210
Realization
The main form add button, click and then pop up the Y axis settings interface.
 private void button12_Click(object sender, EventArgs e)
        {
            addY = new AddY();
            addY.Show();

        }
AddiY is a form object corresponding to the window to be displayed, which is designed as follows
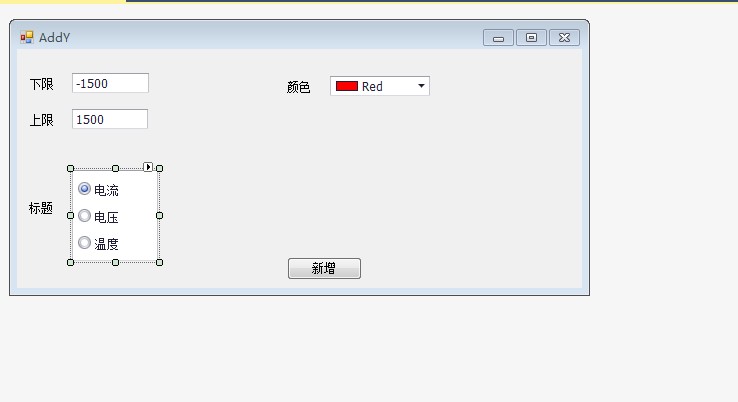
This form has two EditText s to store the upper and lower bounds of the Y axis, then use RadioGroup to set the choice of the title, and then use
ColorEdit Picker chooses colors. All of the above controls use DevExpress controls.
When you click the new button, assign all properties on the control to the declared YAxis object.
private void button1_Click(object sender, EventArgs e)
        {
            YAxis y = new YAxis();
            //Title
            y.Title.Text = this.radioGroup1.Text;
            //colour
            y.Color = this.colorPickEdit1.Color;
            //lower limit
            y.Scale.Min = Double.Parse(this.textEdit1.Text);
            //Upper limit
            y.Scale.Max = Double.Parse(this.textEdit2.Text);

            if (setYaxisEvent != null)
            {
                setYaxisEvent(y);
            }

        }
This uses events and delegates to pass objects across forms.
In AddY's current page code
//Definition of delegation
public delegate void SetYaxisDelegete(YAxis s);
//Event statement
public static event SetYaxisDelegete setYaxisEvent;
Then delegated subscriptions are made in the initialization method of Form1 on the main page
//Add to Y axis
AddY.setYaxisEvent += new AddY.SetYaxisDelegete(addYaxis);
At this point, the addYaxis method name is passed
Method code:
public void addYaxis(YAxis y)
        {
            //If the second article is added Y axis
            if (ycount == 1)
            {
                //Second article Y Axis heading
                myPane.Y2Axis.Title.Text = y.Title.Text.ToString();

                //Second article Y Lower axle limit
                myPane.Y2Axis.Scale.Min = y.Scale.Min;
                //Second article Y Axis upper limit
                myPane.Y2Axis.Scale.Max = y.Scale.Max;
                //Set color
                myPane.Y2Axis.Color = y.Color;
                //Setting the color of the scale line font
                myPane.Y2Axis.Scale.FontSpec.FontColor = y.Color;
                //Setting the font color of the title
                myPane.Y2Axis.Title.FontSpec.FontColor = y.Color;
                //Let second Y Shaft display
                myPane.Y2Axis.IsVisible = true;
                ycount++;
                //close window
                addY.Close();
                zedGraphControl1.Invalidate();

            }
            //Otherwise, we will add Article 3 and above.
            else
            {
                //int yIndex = myPane.YAxisList.Count+1;
                // Create the first yIndex strip Y axis
                YAxis yAxisNew = new YAxis(y.Title.Text.ToString());
                yAxisNew.Scale.Min = y.Scale.Min;
                yAxisNew.Scale.Max = y.Scale.Max;
                //Set up Y Shaft color
                yAxisNew.Color = y.Color;
                //Setting the color of the scale line font
                yAxisNew.Scale.FontSpec.FontColor = y.Color;
                //Setting the font color of the title
                yAxisNew.Title.FontSpec.FontColor = y.Color;
                //yAxisNew.Type = AxisType.Text;
                //Show that the small scale is ____________ false And you can't see the effect.
                //yAxisNew.MinorGrid.IsVisible = true;
                // turn off the opposite tics so the Y2 tics don't show up on the Y axis
                //Turn off the opposite tics,send y2 tics Not shown y Shaft
                yAxisNew.MajorTic.IsInside = true;
                yAxisNew.MinorTic.IsInside = true;
                yAxisNew.MajorTic.IsOpposite = true;
                yAxisNew.MinorTic.IsOpposite = true;


                // Align the Y2 axis labels so they are flush to the axis
                //alignment Y2 Axis label to align with axis
                //yAxisNew.Scale.Align = AlignP.Inside;
                //Add to Y Axial list
                myPane.YAxisList.Add(yAxisNew);
                //close window
                addY.Close();
                zedGraphControl1.Invalidate();
            }
        }
Effect