Author: Gao Peng At the end of the article is his book "Deep Understanding of MySQL Master-slave Principle 32 Lecture". Deep and thorough understanding of MySQL Master-slave, GTID related technical knowledge.
This article is excerpted from Section 29 of Understanding MySQL Principles of Master and Subordinate Note: This article is divided into two parts: the text and the attachment. They are all picture formats. If the text is not clear, you can save the attachment's picture to local view.
background
I'd like to briefly talk about the construction of my MySQL debugging environment, but before that I have to talk about what threads are, because if we don't explain what threads are, simple debugging may be hindered, and understanding threads is also very helpful for us to diagnose performance problems with ordinary DBA s. But explaining threads in detail is beyond my capabilities and beyond the scope of this series. Specifically, I recommend two books to you:
- POSIX Multithread Programming
- Linux UNIX System Programming Manual Chapters 29-32 The first book is very old, but I think it's OK. If you are interested, you can refer to it.
Introduction to Threads
We know that mysqld is a single-process multi-threaded user program, so we need to know what threads. In fact, all threads in MySQL are POSIX threads, such as our session threads, DUMP threads, IO threads and some other InnoDB threads are POSIX threads.
A process is actually a running program. A process can contain multiple threads or only one thread. Threads in Linux are also called light-weight process es (LWP) for short. The first thread of a process is usually called the master thread. Processes are the smallest unit of memory allocation and threads are the smallest unit of CPU scheduling. That is to say, if the CPU has enough cores, multiple threads can achieve the effect of parallel processing, and the kernel can directly schedule threads. Below is a picture I saw when I studied Linux threads. I redrawn it below for your reference (Figure 29-1, the original HD image is included in the original picture at the end of the article):

All threads within a process have the same code program, heap, global variables, shared libraries, etc., but each thread has its own independent stack space and registers, and they share the virtual memory address space of the process. Let's assume that the mysqld process under 32-bit operating system has the following virtual memory address schematic diagram. In fact, this diagram is also drawn with reference to the "Linux UNIX System Programming Manual" (Figure 29-2, the original high-definition image is included in the original image at the end of the article):
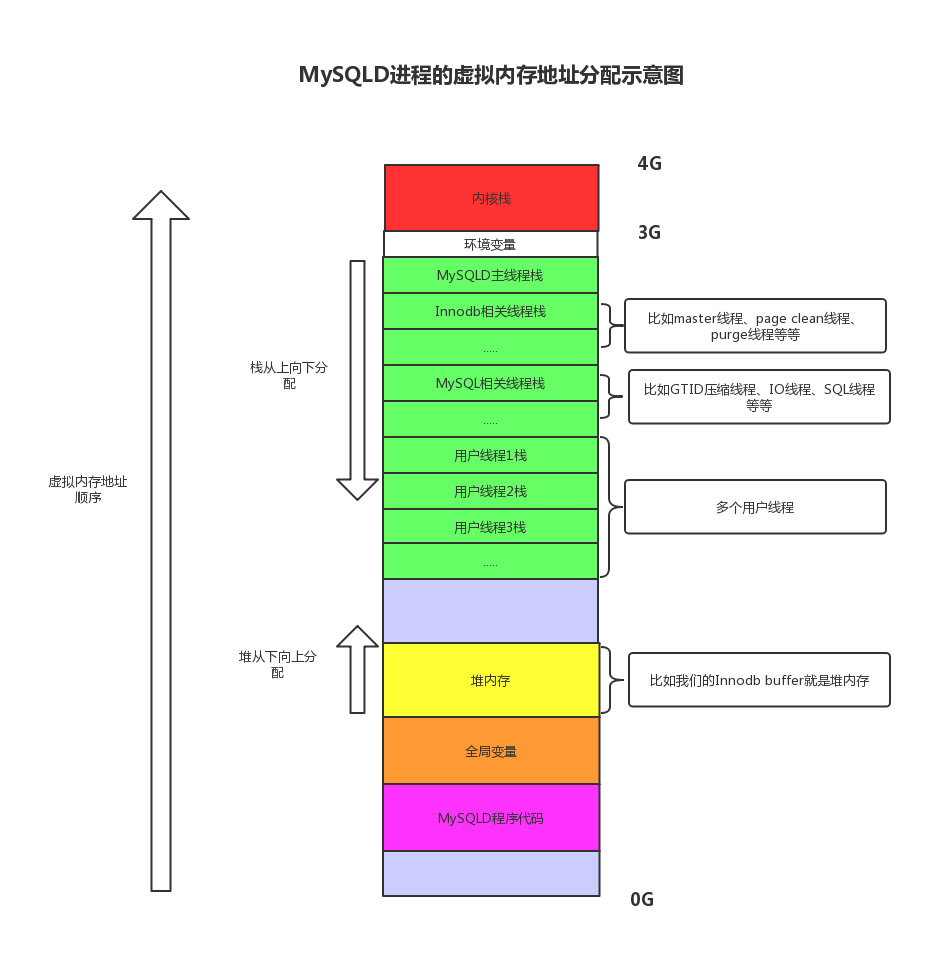
We find that the heap memory and global variables of threads are shared, so data sharing between threads is very easy, but to control these shared memory, we need to introduce our thread synchronization technology, such as Mutex.
If you want to know what resources threads share and what strengths and weaknesses threads and processes have, you can refer to the books I gave above.
II. PID, LWP ID, Thread TID
If you want to debug, you need to understand these three IDs. Among them, PID and LWP ID s are more important, because they will be encountered in debugging and operation, and Thread TID is seldom used without multi-threading development. Here is my summary of them:
- PID: Kernel allocation, used to identify the ID of each process. This should be the most familiar one.
- LWP ID: Kernel allocation, used to identify the ID of each thread, it is like a thread is `PID'. All threads under the same process have the same PID, but the LWP ID of the main thread is different. The LWP ID of the main thread is the process PID.
- Thread TID: The internal ID used within a process to identify threads is rarely used.
Next, I wrote a simple C test program to only observe these IDs. It creates a thread through the main thread, that is to say, the process contains two threads. They print their own PID, LWP ID and Thread TID respectively, and then do a cycle self-adding operation to cause high CPU consumption for easy observation. Then we use the top-H and ps-eLlf commands of Linux to observe them separately.
- Program output
The following is the output of the program:
# ./gaopengtest
main thread: pid 13188 tid 2010470144 lwp 13188
new thread:  pid 13188 tid 2010461952 lwp 13189
We can see that the IDs of both threads are 13188, but the LWP ID of the main thread is 13188, and that of the newly established thread is 13189. Then there's Thread TID, but explain more.
- The top-H observations are as follows:
We can see that both threads are CPU-intensive threads, and the CPU is already saturated. Here we see that the output of the top-H command `PID'is LWP ID. Here we can also see that their memory information is exactly the same. Memory information is actually the memory information of the whole process, because the process is the smallest unit of memory allocation.

Note that if you look at the process at this time, it takes up more than 100% of the cpu, close to 200%, as follows:

- Ps-eLlf observations are as follows:
We can see that this includes PID and LWP ID, but more explanation, you can try it on your own.

3. How to Correspond MySQL Threads with LWP ID s
In 5.7, we can already match MySQL statements with LWP IDs, which makes performance diagnosis more convenient. For example, if the two CPU-intensive threads in the column above are MySQL threads, then we get the LWP ID of the threads, and then we can find out which threads are MySQL threads through statements. Statements are as follows:
mysql> select a.thd_id,b.THREAD_OS_ID,a.user
,b.TYPE from  sys.processlist
a,performance_schema.threads  b where b.thread_id=a.thd_id;
+--------+--------------+---------------------------+---------+------------
| thd_id | THREAD_OS_ID | user                      | conn_id | TYPE
+--------+--------------+---------------------------+---------+------------
|      1 |        16370 | sql/main                  |    NULL | BACKGROUND
|      2 |        17202 | sql/thread_timer_notifier |    NULL | BACKGROUND
|      3 |        17207 | innodb/io_ibuf_thread     |    NULL | BACKGROUND
|      4 |        17208 | innodb/io_log_thread      |    NULL | BACKGROUND
|      5 |        17209 | innodb/io_read_thread     |    NULL | BACKGROUND
|      6 |        17210 | innodb/io_read_thread     |    NULL | BACKGROUND
|      7 |        17211 | innodb/io_read_thread     |    NULL | BACKGROUND
|      8 |        17212 | innodb/io_read_thread     |    NULL | BACKGROUND
|      9 |        17213 | innodb/io_read_thread     |    NULL | BACKGROUND
|     10 |        17214 | innodb/io_read_thread     |    NULL | BACKGROUND
|     11 |        17215 | innodb/io_read_thread     |    NULL | BACKGROUND
|     12 |        17216 | innodb/io_read_thread     |    NULL | BACKGROUND
|     13 |        17217 | innodb/io_write_thread    |    NULL | BACKGROUND
|     14 |        17218 | innodb/io_write_thread    |    NULL | BACKGROUND
|     15 |        17219 | innodb/io_write_thread    |    NULL | BACKGROUND
|     16 |        17220 | innodb/io_write_thread    |    NULL | BACKGROUND
|     17 |        17221 | innodb/io_write_thread    |    NULL | BACKGROUND
......
Here THREAD_OS_ID is the LWP ID of the thread. Then we use the ps-eLlf command just now to look at it again, as follows:
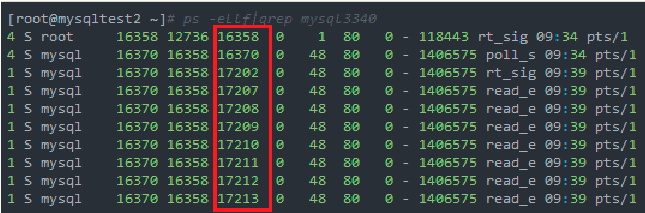
We can find that they can cope with it. It's better to try it on your own.
IV. Construction of debugging environment
I think that no matter what method is used, as long as it can play the role of debugging. Here is my method. I use gdb debugging directly under Linux. I think this method is very simple and effective. Basically, as long as I can install the source code, I can complete the debugging environment. Let's look at the steps below:
1. The first step is to download MySQL source package and decompress it.
I downloaded the official 5.7.26 source code.
2. Use source installation to install MySQL. Note the need to turn on the debug option
Here are the options I use:
cmake -DCMAKE_INSTALL_PREFIX=/root/sf/mysql3312/ \
-DMYSQL_DATADIR=/root/sf/mysql3312/data/ \
-DSYSCONFDIR=/root/sf/mysql3312/ \
-DWITH_INNOBASE_STORAGE_ENGINE=1 \
-DWITH_ARCHIVE_STORAGE_ENGINE=1 \
-DWITH_BLACKHOLE_STORAGE_ENGINE=1 \
-DWITH_FEDERATED_STORAGE_ENGINE=1 \
-DWITH_PARTITION_STORAGE_ENGINE=1 \
-DMYSQL_UNIX_ADDR=/root/sf/mysql3312/mysql3312.sock \
-DMYSQL_TCP_PORT=3306 \
-DENABLED_LOCAL_INFILE=1 \
-DEXTRA_CHARSETS=all \
-DDEFAULT_CHARSET=utf8 \
-DDEFAULT_COLLATION=utf8_general_ci \
-DMYSQL_USER=mysql \
-DWITH_BINLOG_PREALLOC=ON \
-DWITH_BOOST=/root/sf/mysql-5.7.26/boost/boost_1_59_0 -DWITH_DEBUG=1
Note that the last - DWITH_DEBUG=1 must be turned on.
3. make && make install
Compile and install.
4. Prepare parameter files and initialize MySQL database, and ensure that it can be started successfully
This step should be handled by oneself, paying attention to authority. My environment started successfully as follows:
[root@gp1 support-files]# ./mysql.server start
Starting MySQL....... SUCCESS!
[root@gp1 support-files]# ./mysql.server stop
Shutting down MySQL.. SUCCESS!
5. Prepare the gdb command file
The following is the command file I prepared:
[root@gp1 ~]# more debug.file
break main
run --defaults-file=/root/sf/mysql3312/my.cnf --user=mysql --gdb
The first line breaks a breakpoint at the main function. The second line is when gdb calls mysqld, what parameters are added to mysqld, and note that run does not write it out.
6. Start MySQL with gdb
Start the debugging environment with the following commands:
gdb -x /root/debug.file /root/sf/mysql3312/bin/mysqld
Here is my record of success in starting the debugging environment:
# gdb -x /root/debug.file /root/sf/mysql3312/bin/mysqld
GNU gdb (GDB) Red Hat Enterprise Linux (7.2-92.el6)
Copyright (C) 2010 Free Software Foundation, Inc.
License GPLv3+: GNU GPL version 3 or later <http://gnu.org/licenses/gpl.html>
This is free software: you are free to change and redistribute it.
There is NO WARRANTY, to the extent permitted by law.  Type "show copying"
and "show warranty" for details.
This GDB was configured as "x86_64-redhat-linux-gnu".
For bug reporting instructions, please see:
<http://www.gnu.org/software/gdb/bugs/>...
Reading symbols from /root/sf/mysql3312/bin/mysqld...done.
Breakpoint 1 at 0xec7c53: file /root/sf/mysql-5.7.26/sql/main.cc, line 25.
[Thread debugging using libthread_db enabled]

Breakpoint 1, main (argc=5, argv=0x7fffffffe3b8) at /root/sf/mysql-5.7.26/sql/main.cc:25
25        return mysqld_main(argc, argv);
Missing separate debuginfos, use: debuginfo-install glibc-2.12-1.212.el6.x86_64 libaio-0.3.107-10.el6.x86_64 libgcc-4.4.7-18.el6.x86_64 libstdc++-4.4.7-18.el6.x86_64 nss-softokn-freebl-3.14.3-23.3.el6_8.x86_64
(gdb) c
Continuing.
[New Thread 0x7fffee883700 (LWP 29375)]
[New Thread 0x7fff9a9f3700 (LWP 29376)]
[New Thread 0x7fff99ff2700 (LWP 29377)]
[New Thread 0x7fff995f1700 (LWP 29378)]
[New Thread 0x7fff98bf0700 (LWP 29379)]
[New Thread 0x7fff981ef700 (LWP 29380)]
[New Thread 0x7fff977ee700 (LWP 29381)]
[New Thread 0x7fff96ded700 (LWP 29382)]
[New Thread 0x7fff963ec700 (LWP 29383)]
.....
Have you noticed the LWP ID here, as we discussed earlier? At this time, MySQL client program can connect mysqld as follows:
# /root/sf/mysql3312/bin/mysql -S'/root/sf/mysql3312/mysql3312.sock'
Welcome to the MySQL monitor.  Commands end with ; or \g.
Your MySQL connection id is 2
Server version: 5.7.26-debug-log Source distribution

Copyright (c) 2000, 2019, Oracle and/or its affiliates. All rights reserved.

Oracle is a registered trademark of Oracle Corporation and/or its
affiliates. Other names may be trademarks of their respective
owners.

Type 'help;' or '\h' for help. Type '\c' to clear the current input statement.

mysql> select version() ;
+------------------+
| version()        |
+------------------+
| 5.7.26-debug-log |
+------------------+
1 row in set (0.00 sec)
Now that the basic debugging environment is set up, we can find that it is very simple. Then we can debug the breakpoint. My commonly used gdb command includes:
- info threads: view all threads
- thread n: Specify a thread
- bt: View a thread stack frame
- b: Setting breakpoints
- c: Continue to implement
- s: Execute a line of code and enter the function if the code function is called
- n: Execute a line of code, function calls are not entered
- p: Print a variable value
- list: Text information for printing code
Of course, gdb has a lot of commands, you can refer to other information on your own.
6. A column of problems in using debugging environment to prove
Here's an example of how to use the debugging environment. As we said in Section 15 above, binlog cache is written to binary log at the flush stage of order commit, calling the function binlog_cache_data::flush. Well, we can hit the breakpoint to this function as follows:
(gdb) b binlog_cache_data::flush
Breakpoint 2 at 0x1846333: file /root/sf/mysql-5.7.26/sql/binlog.cc, line 1674.
Then we execute a transaction on the MySQL client as follows and submit:
mysql> begin;
Query OK, 0 rows affected (0.00 sec)
mysql> insert into gpdebug values(1);
Query OK, 1 row affected (0.03 sec)
mysql> commit;
The card owner was already in commit, and the breakpoint triggered as follows:
Breakpoint 2, binlog_cache_data::flush (this=0x7fff3c00df20...)
    at /root/sf/mysql-5.7.26/sql/binlog.cc:1674
1674      DBUG_ENTER("binlog_cache_data::flush");
We use the bt command to look at the stack frame and find the following:
#0  binlog_cache_data::flush
at /root/sf/mysql-5.7.26/sql/binlog.cc:1674
#1  0x0000000001861b41 in binlog_cache_mngr::flush
at /root/sf/mysql-5.7.26/sql/binlog.cc:967
#2  0x00000000018574ce in MYSQL_BIN_LOG::flush_thread_caches
at /root/sf/mysql-5.7.26/sql/binlog.cc:8894
#3  0x0000000001857712 in MYSQL_BIN_LOG::process_flush_stage_queue
at /root/sf/mysql-5.7.26/sql/binlog.cc:8957
#4  0x0000000001858d19 in MYSQL_BIN_LOG::ordered_commit
at /root/sf/mysql-5.7.26/sql/binlog.cc:9595
#5  0x00000000018573b4 in MYSQL_BIN_LOG::commit
at /root/sf/mysql-5.7.26/sql/binlog.cc:8851
#6  0x0000000000f58de9 in ha_commit_trans
at /root/sf/mysql-5.7.26/sql/handler.cc:1799
#7  0x000000000169e02b in trans_commit
at /root/sf/mysql-5.7.26/sql/transaction.cc:239
......
Well, if you look at this stack frame, you can prove our statement. If you want to learn more about the code, you can learn from this stack frame. But it is worth noting that this is based on the premise of knowing the function of function interface. If we don't know that writing binary log will call the binlog_cache_data::flush function, then debugging will be difficult, and I often encounter such a dilemma. So throughout the series, I have provided many such interfaces for interested friends to debug and test.
Finally, I recommend Gao Peng's column "Deep Understanding MySQL Principle 32 Lectures". Friends who want to know the principle of MySQL master-slave thoroughly should not miss it.
