Neither profound mathematical knowledge nor profound financial knowledge is needed. In this paper, various advanced investment models or mathematical models will not be quoted. That's not necessary. That's not necessary. How on earth do you use python to buy stocks? Look Down
trading system
Before trading, we should first have a trading system to guide our own trading, not necessarily have any norms, but can be used as a basis for trading, as to whether this basis is feasible, science or not, there are different opinions.
Of course, the trading system here is not necessarily a program. It just refers to your own trading principles or some techniques or methods that you follow. You can execute them manually or with the help of a programming language. A programming language is not a set of tools for use.
Here refer to the trading system in the Turtle Trading Rules (here is only the general direction).
To establish a perfect trading system, we should consider at least six aspects.
1. Market - what to buy and sell
2. Size of Position - How Much to Buy and Sell
3. Entry - When to Buy
4. Stop Loss - When to Withdraw from Loss Position
5. Stop Earnings - When to Quit Profitable Position
6. Departure - When to Departure
A simple example
Buying and selling A shares
Full warehouse
Buy more than 3% on the day.
When the loss of holding position exceeds 3%, liquidate the position.
The day's decline was more than 3% or three consecutive negative lines
Analysis: This trading strategy can only be profitable when the market is wavy and upward. If it is consolidated, it is feared that it will lose a lot. The reason why this is so simple and rude is that the code of the later strategy test is simple.
Data Acquisition and Processing
Because what is said here is to use python to speculate in stocks, so we should use the method of program to obtain data. If we speculate in stocks manually, it is possible to download any stock quotation software, but the manual execution needs more energy.
The most famous database in python language is tushare.
Let's take the stock of Lexin Securities as an example.
python environment installation
Get market data
import pandas as pd
import tushare as ts
Get stock data through the stock code. There are no start and end dates specified here.
df = ts.get_k_data("300104")
Look at the top ten data
df.head()
Look at the last ten pieces of data
df.tail()
Converting the index of data to the date corresponding to the date field
df.index = pd.to_datetime(df.date)
Delete the redundant date field
df.drop("date", inplace=True, axis=1)
Calculating Common Indicators
# Calculate the moving average of 5, 15, 50 days, MA5, MA15, MA50
days = [5, 15, 50]
for ma in days:
    column_name = "MA{}".format(ma)
    df[column_name] = pd.rolling_mean(df.close, ma)

# Calculate floating ratio
df["pchange"] = df.close.pct_change()
# Calculate floating point number
df["change"] = df.close.diff()
The final results are as follows:
df.head()
Out[13]:
             open  close   high    low    volume    code     MA5  MA15  MA50  \
date
2013-11-29  9.396  9.741  9.870  9.389  146587.0  300104     NaN   NaN   NaN
2013-12-02  9.298  8.768  9.344  8.768  177127.0  300104     NaN   NaN   NaN
2013-12-03  8.142  8.414  8.546  7.890  176305.0  300104     NaN   NaN   NaN
2013-12-04  8.391  8.072  8.607  8.053  120115.0  300104     NaN   NaN   NaN
2013-12-05  7.983  7.366  8.108  7.280  253764.0  300104  8.4722   NaN   NaN

             pchange  change
date
2013-11-29       NaN     NaN
2013-12-02 -0.099887  -0.973
2013-12-03 -0.040374  -0.354
2013-12-04 -0.040647  -0.342
visualization
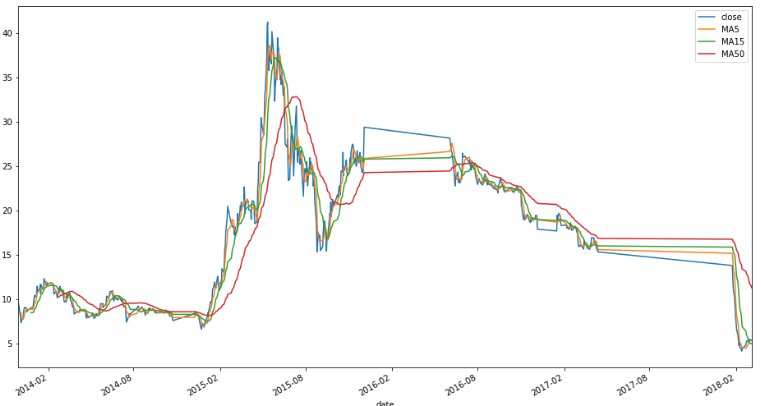
Trend chart
The so-called "one picture wins the preface", the data visualization can be very intuitive to feel the trend of the stock.
Personally, I think that if we use the program to speculate in stocks, we should quantify everything. We should not have too many subjective opinions. If we rely too much on intuition or mood at that time, then it is really unnecessary to use the program to analyze.
df[["close", "MA5", "MA15", "MA50"]].plot(figsiz=(10,18))
The results are as follows:
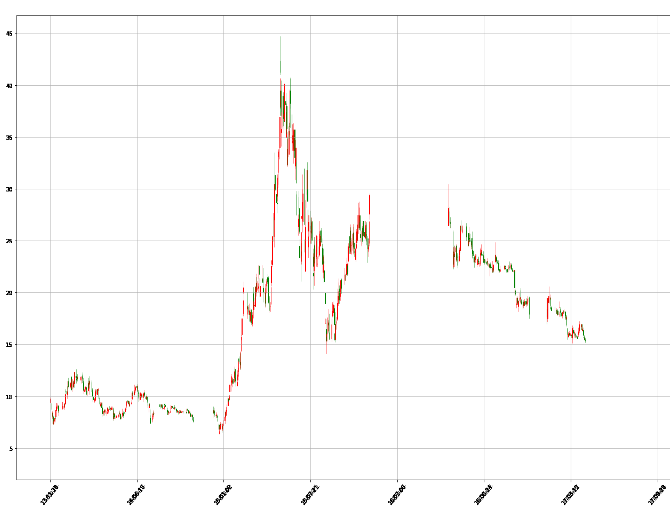
k-line diagram
import matplotplib.pyplot as plt
from matplotlib.daet import DateFormatter
from matplotlib.finance import date2num, candlestick_ohlc

def candlePlot(data, title=""):
    data["date"] = [date2num(pd.to_datetime(x)) for x in data.index]
    dataList = [tuple(x) for x in data[
        ["date", "open", "high", "low", "close"]].values]

    ax = plt.subplot()
    ax.set_title(title)
    ax.xaxis.set_major_formatter(DateFormatter("%y-%m-%d"))
    candlestick_ohlc(ax, dataList, width=0.7, colorup="r", colordown="g")
    plt.setp(plt.gca().get_xticklabels(), rotation=50,
             horizontalalignment="center")
    fig = plt.gcf()
    fig.set_size_inches(20, 15)
    plt.grid(True)

candlePlot(df)
The results are as follows:
Strategy testing
Manual code Beijing Oriental A(000725).
//What I don't know in the process of learning can be added to me?
python Learning Exchange Button qun,784758214
//There are good learning video tutorials, development tools and e-books in the group.
//Share with you the current talent needs of python enterprises and how to learn python from zero foundation, and what to learn
# Import related modules
import tushare as ts
import pandas as pd

# get data
df = ts.get_k_data("000725")

# Processing data
df.index = pd.to_datetime(df.date)
df.drop("date", axis=1, inplace=True)

# Calculate floating ratio
df["pchange"] = df.close.pct_change()
# Calculate floating point number
df["change"] = df.close.diff()

# View the first five rows of current data
             open  close   high    low      volume    code   pchange  change
date
2015-07-20  4.264  4.234  4.342  4.165  13036186.0  000725       NaN     NaN
2015-07-21  4.136  4.195  4.274  4.096   8776773.0  000725 -0.009211  -0.039
2015-07-22  4.175  4.146  4.214  4.067   9083703.0  000725 -0.011681  -0.049
2015-07-23  4.136  4.254  4.283  4.096  12792734.0  000725  0.026049   0.108
2015-07-24  4.224  4.136  4.254  4.106  13009620.0  000725 -0.027739  -0.118

# Set the withdrawal value
withdraw = 0.03
# Setting Breakthrough Value
breakthrough = 0.03
# Setting up Account Funds
account = 10000
# Number of hands holding positions
position = 0

def buy(bar):
    global account, position
    print("{}: buy {}".format(bar.date, bar.close))
    # First-hand price
    one = bar.close * 100
    position = account // one
    account = account - (position * one)

def sell(bar):
    global account, position
    # First-hand price
    print("{}: sell {}".format(bar.date, bar.close))
    one = bar.close * 100
    account += position * one
    position = 0

print("Start time investment time: ", df.iloc[0].date)
for date in df.index:
    bar = df.loc[date]
    if bar.pchange and bar.pchange > breakthrough and position == 0:
        buy(bar)
    elif bar.pchange and bar.pchange < withdraw and position > 0:
        sell(bar)

print("Ultimately there will be cash.: ", account)
print("Ultimately holding market value: ", position * df.iloc[-1].close * 100)
The output is as follows:
Starting time: 2015-07-20
2015-07-29: buy 3.83
2015-07-30: sell 3.653
2015-08-04: buy 3.752
...
2018-02-27: sell 5.71
2018-03-06: buy 5.79
Final cash available: 333.3
Final market capitalization: 7527.0
CONCLUSION: Through the above tests, we found that we lost more than 2,000 yuan.
With the help of test framework
With the help of the test frame, the correct retreat posture is achieved, because the frame contains more functions. pyalgotrade is used here.
Simple use
from pyalgotrade import strategy
from pyalgotrade import technical
from pyalgotrade.barfeed import yahoofeed

# Custom Event Window Class
class DiffEventWindow(technical.EventWindow):
    def __init__(self, period):
        assert(period > 0)
        super(DiffEventWindow, self).__init__(period)
        self.__value = None

    def onNewValue(self, dateTime, value):
        super(DiffEventWindow, self).onNewValue(dateTime, value)
        if self.windowFull():
            lastValue = self.getValues()[0]
            nowValue = self.getValues()[1]
            self.__value = (nowValue - lastValue) / lastValue

    def getValue(self):
        return self.__value

# Custom Indicators
``
class Diff(technical.EventBasedFilter):
    def __init__(self, dataSeries, period, maxLen=None):
        super(Diff, self).__init__(dataSeries, DiffEventWindow(period), maxLen)

# Define your own strategy

class MyStrategy(strategy.BacktestingStrategy):
    def __init__(self, feed, instrument, diffPeriod=2):
        # Input feed s and initial account funds
        super(MyStrategy, self).__init__(feed, 10000)
        self.__instrument = instrument
        self.__position = None
        self.setUseAdjustedValues(True)
        self.__prices = feed[instrument].getPriceDataSeries()
        self.__diff = Diff(self.__prices, diffPeriod)
        self.__break = 0.03
        self.__withdown = -0.03

    def getDiff(self):
        return self.__diff

    def onEnterCanceled(self, position):
        self.__position = None

    def onEnterOk(self, position):
        execInfo = position.getEntryOrder().getExecutionInfo()
        self.info("BUY at $%.2f" % (execInfo.getPrice()))

    def onExitOk(self, position):
        execInfo = position.getExitOrder().getExecutionInfo()
        self.info("SELL at $%.2f" % (execInfo.getPrice()))
        self.__position = None

    def onExitCanceled(self, position):
        # If the exit was canceled, re-submit it.
        self.__position.exitMarket()

    def onBars(self, bars):
        account = self.getBroker().getCash()
        bar = bars[self.__instrument]
        if self.__position is None:
            one = bar.getPrice() * 100
            oneUnit = account // one
            if oneUnit > 0 and self.__diff[-1] > self.__break:
                self.__position = self.enterLong(self.__instrument, oneUnit * 100, True)
        elif self.__diff[-1] < self.__withdown and not self.__position.exitActive():
            self.__position.exitMarket()

def runStrategy():

    # Download data


    jdf = ts.get_k_data("000725")

    # New Adj Close field
    jdf["Adj Close"] =jdf.close

    # Save the fields of data under tushare as the data format required by pyalgotrade
    jdf.columns = ["Date", "Open", "Close", "High", "Low", "Volume", "code", "Adj Close"]

    # Save data to a cost-effective csv file
    jdf.to_csv("jdf.csv", index=False)

    feed = yahoofeed.Feed()
    feed.addBarsFromCSV("jdf", "jdf.csv")

    myStrategy = MyStrategy(feed, "jdf")

    myStrategy.run()
    print("Final portfolio value: $%.2f" % myStrategy.getResult())

    runStrategy()
The output is as follows
2015-07-30 00:00:00 strategy [INFO] BUY at $3.78
2015-07-31 00:00:00 strategy [INFO] SELL at $3.57
2015-08-05 00:00:00 strategy [INFO] BUY at $3.73
2015-08-06 00:00:00 strategy [INFO] SELL at $3.56
...
2018-02-13 00:00:00 strategy [INFO] BUY at $5.45
Final portfolio value: $7877.30
At first glance, it seems that more code is written with the framework, but more analysis tools are built into the framework.
Here is a brief introduction.
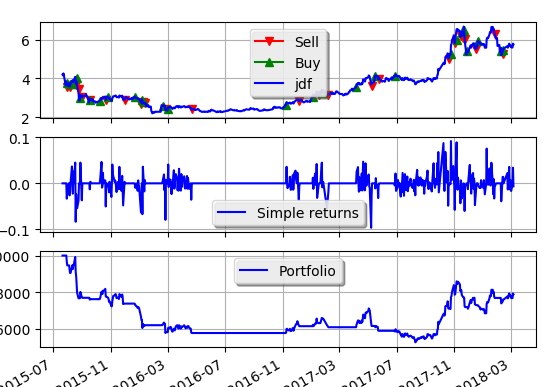
Strategy visualization
from pyalgotrade import strategy
from pyalgotrade import technical
from pyalgotrade.barfeed import yahoofeed
from pyalgotrade import plotter
from pyalgotrade.stratanalyzer import returns

class DiffEventWindow(technical.EventWindow):
    def __init__(self, period):
        assert(period > 0)
        super(DiffEventWindow, self).__init__(period)
        self.__value = None

    def onNewValue(self, dateTime, value):
        super(DiffEventWindow, self).onNewValue(dateTime, value)
        if self.windowFull():
            lastValue = self.getValues()[0]
            nowValue = self.getValues()[1]
            self.__value = (nowValue - lastValue) / lastValue

    def getValue(self):
        return self.__value

class Diff(technical.EventBasedFilter):
    def __init__(self, dataSeries, period, maxLen=None):
        super(Diff, self).__init__(dataSeries, DiffEventWindow(period), maxLen)

class MyStrategy(strategy.BacktestingStrategy):
    def __init__(self, feed, instrument, diffPeriod=2):
        super(MyStrategy, self).__init__(feed, 10000)
        self.__instrument = instrument
        self.__position = None
        self.setUseAdjustedValues(True)
        self.__prices = feed[instrument].getPriceDataSeries()
        self.__diff = Diff(self.__prices, diffPeriod)
        self.__break = 0.03
        self.__withdown = -0.03

    def getDiff(self):
        return self.__diff

    def onEnterCanceled(self, position):
        self.__position = None

    def onEnterOk(self, position):
        execInfo = position.getEntryOrder().getExecutionInfo()
        self.info("BUY at $%.2f" % (execInfo.getPrice()))

    def onExitOk(self, position):
        execInfo = position.getExitOrder().getExecutionInfo()
        self.info("SELL at $%.2f" % (execInfo.getPrice()))
        self.__position = None

    def onExitCanceled(self, position):
        # If the exit was canceled, re-submit it.
        self.__position.exitMarket()

    def onBars(self, bars):
        account = self.getBroker().getCash()
        bar = bars[self.__instrument]
        if self.__position is None:
            one = bar.getPrice() * 100
            oneUnit = account // one
            if oneUnit > 0 and self.__diff[-1] > self.__break:
                self.__position = self.enterLong(self.__instrument, oneUnit * 100, True)
        elif self.__diff[-1] < self.__withdown and not self.__position.exitActive():
            self.__position.exitMarket()

def runStrategy():
    # Download data
    jdf = ts.get_k_data("000725")

    # New Adj Close field
    jdf["Adj Close"] =jdf.close

    # Save the fields of data under tushare as the data format required by pyalgotrade
    jdf.columns = ["Date", "Open", "Close", "High", "Low", "Volume", "code", "Adj Close"]

    # Save data to a cost-effective csv file
    jdf.to_csv("jdf.csv", index=False)

    feed = yahoofeed.Feed()
    feed.addBarsFromCSV("jdf", "jdf.csv")

    myStrategy = MyStrategy(feed, "jdf")

    returnsAnalyzer = returns.Returns()
    myStrategy.attachAnalyzer(returnsAnalyzer)
    plt = plotter.StrategyPlotter(myStrategy)
    plt.getInstrumentSubplot("jdf")
    plt.getOrCreateSubplot("returns").addDataSeries("Simple returns", returnsAnalyzer.getReturns())

    myStrategy.run()
    print("Final portfolio value: $%.2f" % myStrategy.getResult())
    plt.plot()

runStrategy()
The picture output is as follows
Stock price monitoring
According to this demand, a semi-finished product of stock price monitoring is written, which is monitored by mailbox.
Project reference: https://github.com/youerning/UserPyScript/tree/master/monitor
Tip: Enable QQ email alert function in the auxiliary function of Wechat, then the notification of stock price changes will be very timely, because Wechat is almost equivalent to SMS.
Here is a brief description of the various configuration items and use methods.
default paragraph
breakthrough represents the percentage of breakthroughs that need to be passed in two values. The breakthroughs in projects are 3% and 5% respectively.
Withdraw represents withdraw and requires two values, 3% and 5% for example.
attention represents the list of stocks of interest, filling in the stock code of interest, separated by blanks
Note: There is no concern about the stock situation, so a lot of concern about the stock may have performance problems.
mail paragraph
Enter the username and password and the recipient's mailbox in turn
position Paragraph
Current stocks and their holding costs.
For example, Beijing Oriental A(000725) shares at 5.76.
000725 = 5.76
If there are multiple positions, there will be multiple corresponding key-value pairs as above.
Use method to refer to readme of the script
https://github.com/youerning/UserPyScript/blob/master/monitor/README.md
PS: Unfortunately, the English level is not good, but also because of the annotations, as well as the use of English vocabulary as variable names, if the words are not satisfactory, please forgive me.
If you are still confused in the world of programming, you can join our Python Learning button qun: 784758214 to see how our predecessors learned. Exchange of experience. From basic Python script to web development, crawler, django, data mining, zero-base to actual project data are sorted out. To every Python buddy! Share some learning methods and small details that need attention. Click to join us. python learner gathering place
Place an order
I haven't let the program execute automatically for the time being, because I haven't polished a suitable system for myself and believe in it yet, so I rely on the notification of stock price monitoring and carry out the transaction manually according to the constantly revised system.