1. Data acquisition
The origin of this thing is that on a sunny afternoon... Habitual opening knows you're ready to go down and see a question just invite an answer.

So it sprouted up to collect information about Python job recruitment on a recruitment website, look at the current salary and job distribution, and do what you say.
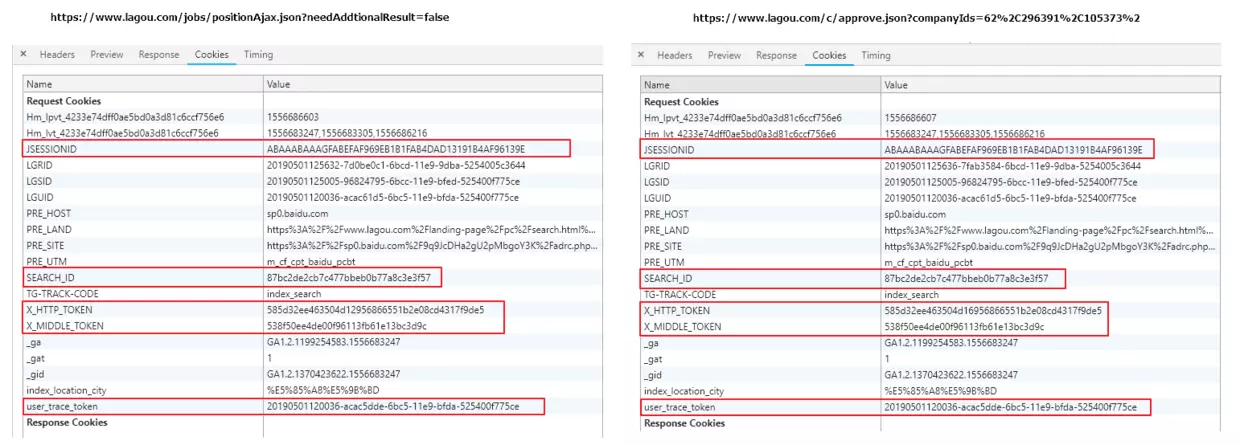
First of all, the request head must be disguised, otherwise the first step will pop up your requests too frequently. Please try again later. Secondly, the website has multiple anti-crawling strategies. The solution is to get sessions first, then update our sessions to grab them, and finally get the idea. The data you want.
Right-click the Chrome browser to check the network and find the link https://www.lagou.com/jobs/positionAjax.json? Need AddtionalResult = false
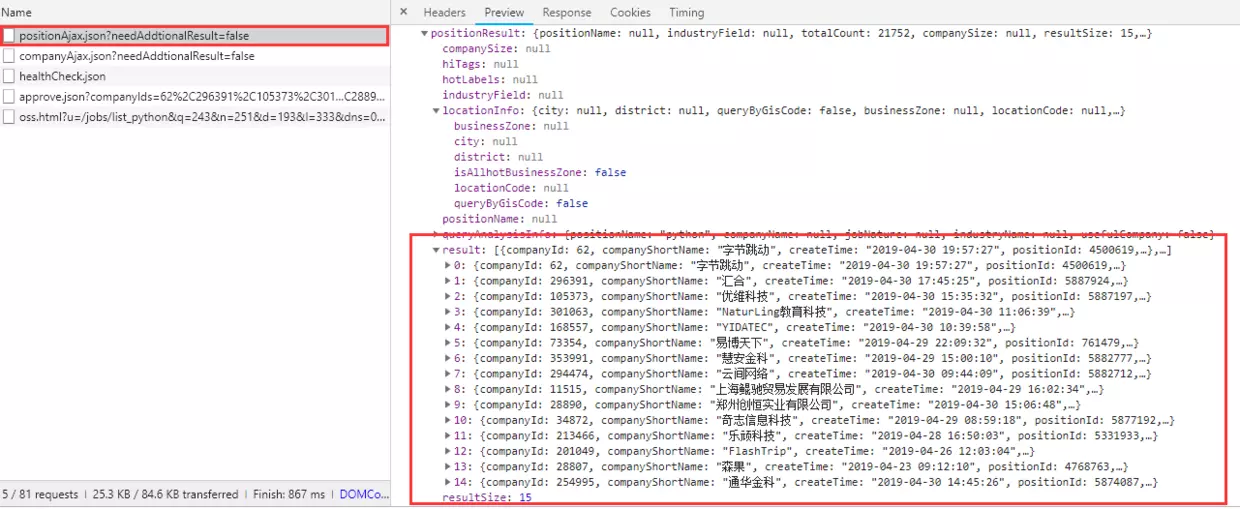
You can see that the returned data is the Python recruitment details of the page, so I opened the direct prompt {status":false,"msg":"You operate too frequently, please visit later","clientIp","124.77.161.207","state": 2402}, tactfully I realized that things were not so simple.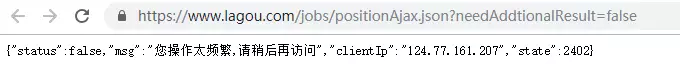
The real battle is just beginning. Let's first analyze the requested message.
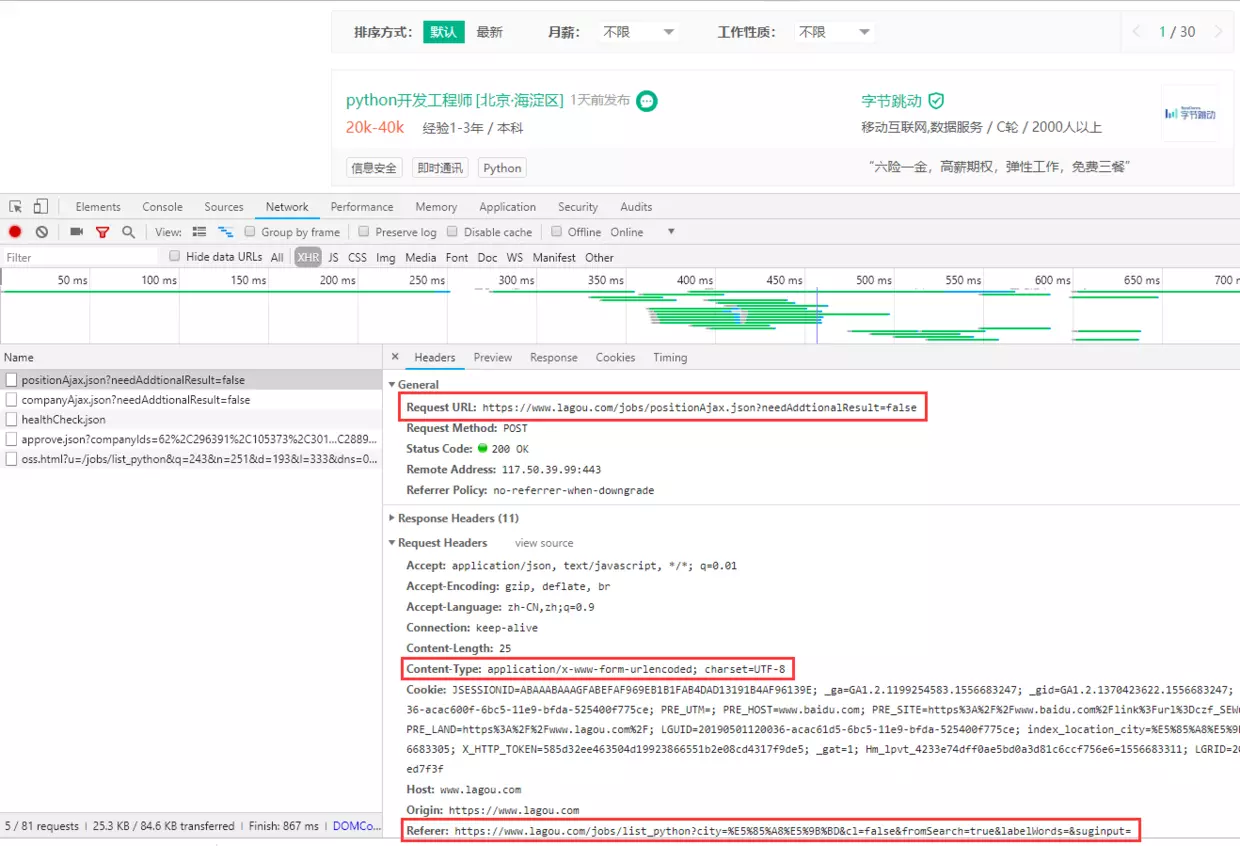
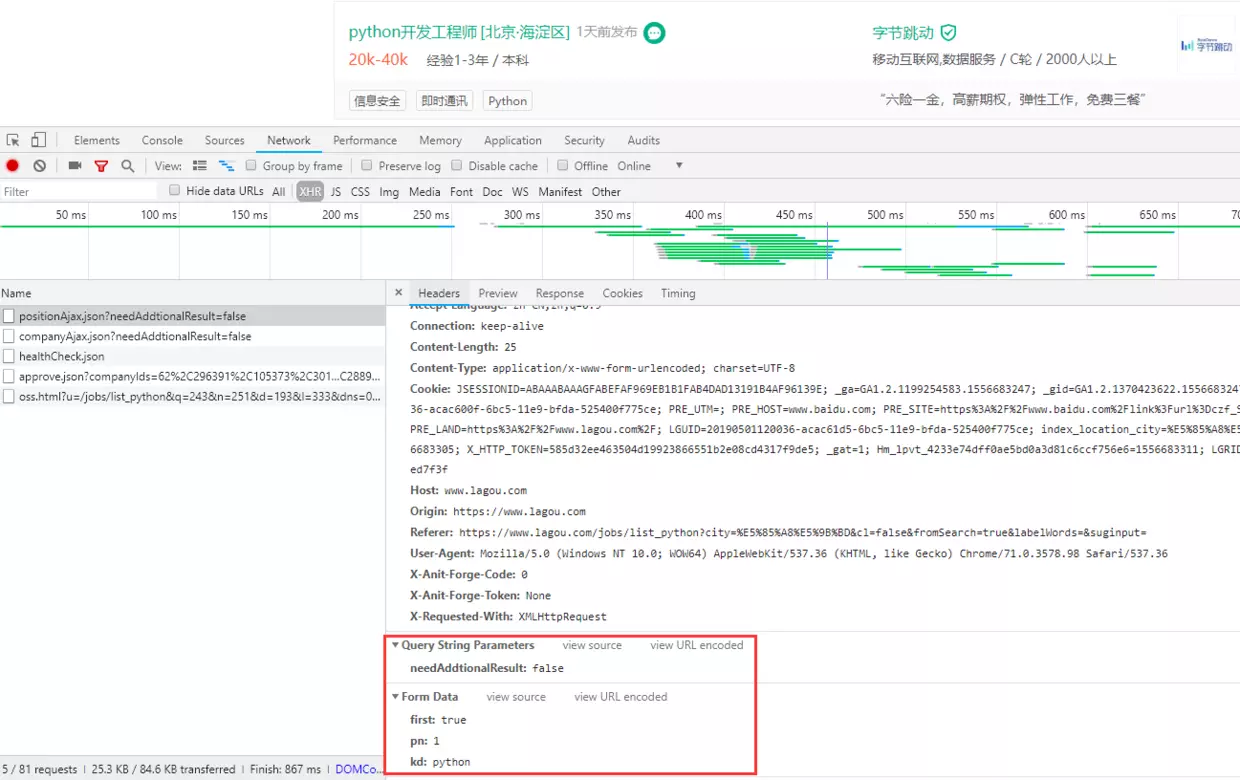
You can see that the request is passed as a post, passing parameters at the same time.
What I don't know in the process of learning can be added to me?
python learning communication deduction qun, 784758214
 There are good learning video tutorials, development tools and e-books in the group.
Share with you the current talent needs of python enterprises and how to learn python from zero foundation, and what to learn
datas = {
            'first': 'false',
            'pn': x,
            'kd': 'python',
        }
At the same time, it is not difficult to find that each click on the next page sends a get request at the same time.
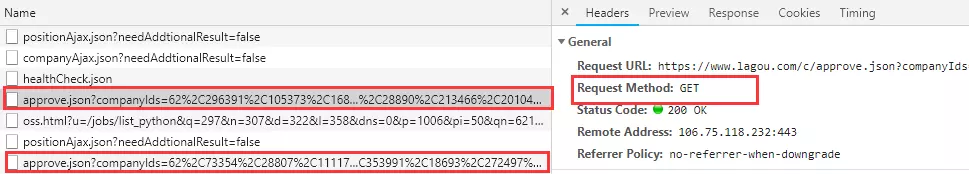
After exploring, we found that this get request is the same as our post request, so the problem is much simpler, sort out the ideas.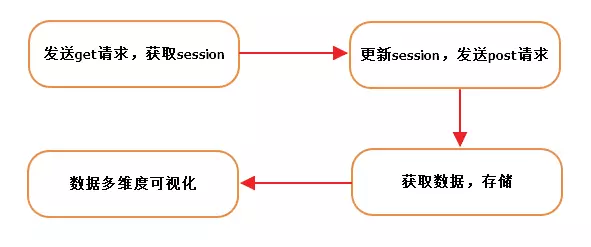
Key words: python ** search scope: ** national ** data aging: ** 2019.05.05
#!/usr/bin/env python3.4
# encoding: utf-8
"""
Created on 19-5-05
@title: ''
@author: Xusl
"""
import json
import requests
import xlwt
import time
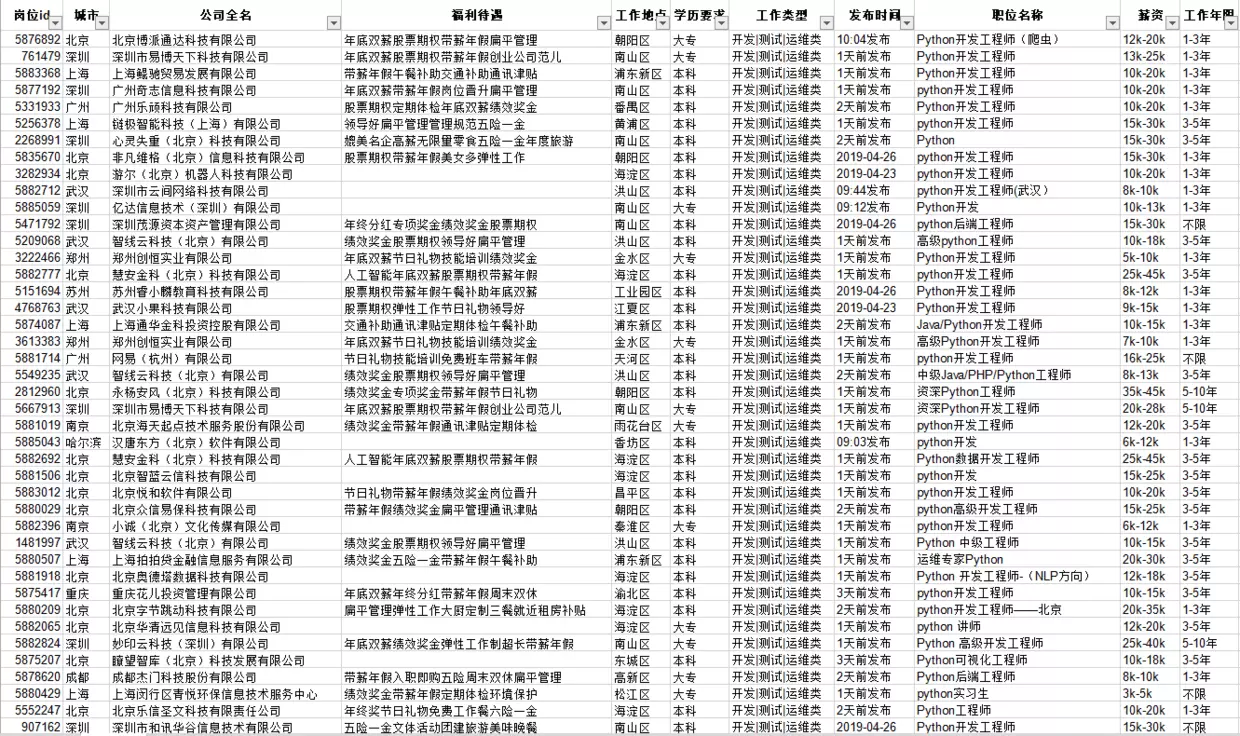
# json object to store job information, traverse to obtain company name, welfare benefits, workplace, academic requirements, type of work, release time, job title, salary, length of service
def get_json(url, datas):
my_headers = {
"User-Agent": "Mozilla/5.0 (Macintosh; Intel Mac OS X 10_13_6) AppleWebKit/537.36 (KHTML, like Gecko) Chrome/72.0.3626.119 Safari/537.36",
"Referer": "https://www.lagou.com/jobs/list_Python?city=%E5%85%A8%E5%9B%BD&cl=false&fromSearch=true&labelWords=&suginput=",
"Content-Type": "application/x-www-form-urlencoded;charset = UTF-8"
}
time.sleep(5)
ses = requests.session() # Get session
ses.headers.update(my_headers) # To update
ses.get("https://www.lagou.com/jobs/list_python?city=%E5%85%A8%E5%9B%BD&cl=false&fromSearch=true&labelWords=&suginput=")
content = ses.post(url=url, data=datas)
result = content.json()
info = result['content']['positionResult']['result']
info_list = []
for job in info:
information = []
information.append(job['positionId']) # Position corresponding ID
information.append(job['city']) # Post corresponding city
information.append(job['companyFullName']) # Full name of company
information.append(job['companyLabelList']) # Fringe benefits
information.append(job['district']) # Place of work
information.append(job['education']) # Educational requirements
information.append(job['firstType']) # Types of work
information.append(job['formatCreateTime']) # Release time
information.append(job['positionName']) # Job title
information.append(job['salary']) # salary
information.append(job['workYear']) # Working life
info_list.append(information)
# The list object is coded in json format, where the indent parameter is indented to 2
# print(json.dumps(info_list, ensure_ascii=False, indent=2))
# print(info_list)
return info_list
def main():
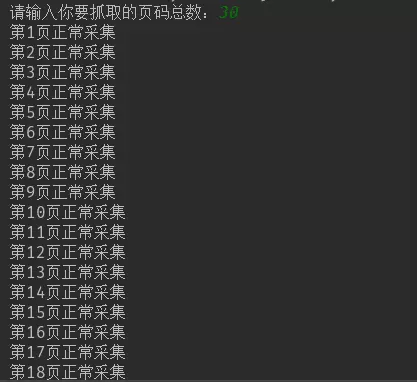
page = int(input('Please enter the total number of pages you want to grab:'))
# kd = input('Please enter the position keyword you want to grab:')
# city = input('Please enter the city you want to grab:')
info_result = []
title = ['post id', 'City', 'Full name of company', 'Fringe benefits', 'Place of work', 'Educational requirements', 'Types of work', 'Release time', 'Job title', 'salary', 'Working life']
info_result.append(title)
for x in range(1, page+1):
url = 'https://www.lagou.com/jobs/positionAjax.json?needAddtionalResult=false'
datas = {
'first': 'false',
'pn': x,
'kd': 'python',
}
try:
info = get_json(url, datas)
info_result = info_result + info
print("The first%s Page Normal Collection" % x)
except Exception as msg:
print("The first%s Page problem" % x)
# Create workbook, excel
workbook = xlwt.Workbook(encoding='utf-8')
# Create a table with the second parameter to confirm whether the same cell cell cell can reset its value
worksheet = workbook.add_sheet('lagouzp', cell_overwrite_ok=True)
for i, row in enumerate(info_result):
# print(row)
for j, col in enumerate(row):
# print(col)
worksheet.write(i, j, col)
workbook.save('lagouzp.xls')
if __name__ == '__main__':
main()
Of course, it's not enough to store in excel. Before that, we used matplotlib to do data visualization. This time we changed something new, pyecharts.
2. Understand pyecharts
pyecharts is a powerful data visualization tool that combines python with echarts, including a variety of charts
- Bar (Column/Bar)
- Bar3D (3D histogram)
- Box plot
- Effect Scatter
- Funnel (funnel chart)
- Gauge (dashboard)
- Geo (Geographic coordinate system)
- Graph
- HeatMap
- Kline (K-line chart)
- Line (polyline/area map)
- Line3D
- Liquid (Water Ball Chart)
- Map (Map)
- Parallel (Parallel coordinate system)
- Pie (pie chart)
- Polar (polar coordinate system)
- Radar (Radar)
- Sankey (Sanjitu)
- Scatter (scatter plot)
- Scatter3D (3D Scatter3D)
- Theme River
- WordCloud
User-defined
- Grid class: Parallel display of multiple graphs
- Overlap class: Overlap on the same graph with different types of Graphs
- Page class: The same page shows multiple images in sequence
- Timeline class: Provides timeline multicast graphs
In addition, it should be noted that starting with version 0.3.2, in order to reduce the size of the project itself and maintain the lightweight operation of the pyecharts project, pyecharts will no longer bring its own map js file. If users need to use map charts (Geo, Map), they can install the corresponding map file packages by themselves.
- Global National Map: echarts-countries-pypkg (1.9MB): World Map and 213 Countries, including China Map
- Provincial Maps of China: echarts-china-provinces-pypkg (730KB): 23 provinces, 5 autonomous regions
- City Map of China: echarts-china-cities-pypkg (3.8MB): 370 Chinese cities
You can also install using commands
pip install echarts-countries-pypkg
pip install echarts-china-provinces-pypkg
pip install echarts-china-cities-pypkg
3. Data visualization (code + presentation)
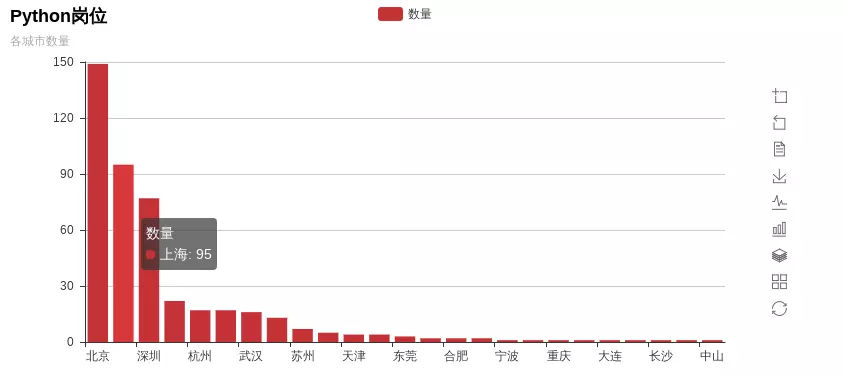
- Number of recruitment in cities
from pyecharts import Bar

city_nms_top10 = ['Beijing', 'Shanghai', 'Shenzhen', 'Chengdu', 'Hangzhou', 'Guangzhou', 'Wuhan', 'Nanjing', 'Suzhou', 'Zhengzhou', 'Tianjin', 'Xi'an', 'Dongguan', 'Zhuhai', 'Hefei', 'Xiamen', 'Ningbo',
                  'Nanning', 'Chongqing', 'Foshan', 'Dalian', 'Harbin', 'Changsha', 'Fuzhou', 'Zhongshan']
city_nums_top10 = [149, 95, 77, 22, 17, 17, 16, 13, 7, 5, 4, 4, 3, 2, 2, 2, 1, 1, 1, 1, 1, 1, 1, 1, 1]

bar = Bar("Python post", "Number of cities")
bar.add("Number", city_nms, city_nums, is_more_utils=True)
# bar.print_echarts_options() # This line only prints configuration items for easy debugging
bar.render('Python Number of posts in cities.html')  # Generate local HTML files
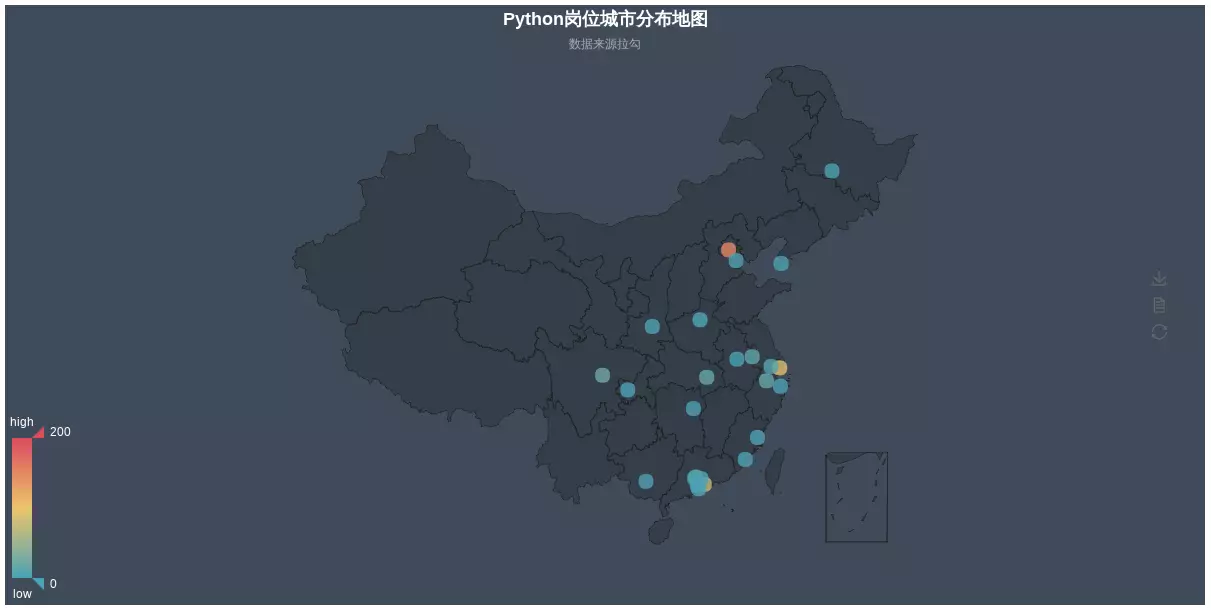
- Map Distribution Display (This scenario is not very meaningful, but more analysis)
from pyecharts import Geo
city_datas = [('Beijing', 149), ('Shanghai', 95), ('Shenzhen', 77), ('Chengdu', 22), ('Hangzhou', 17), ('Guangzhou', 17), ('Wuhan', 16), ('Nanjing', 13), ('Suzhou', 7),
('Zhengzhou', 5), ('Tianjin', 4), ('Xi'an', 4), ('Dongguan', 3), ('Zhuhai', 2), ('Hefei', 2), ('Xiamen', 2), ('Ningbo', 1), ('Nanning', 1), ('Chongqing', 1),
('Foshan', 1), ('Dalian', 1), ('Harbin', 1), ('Changsha', 1), ('Fuzhou', 1), ('Zhongshan', 1)]
geo = Geo("Python Map of Post City Distribution", "Data Source Label", title_color="#fff",
title_pos="center", width=1200,
height=600, background_color='#404a59')
attr, value = geo.cast(city_datas)
geo.add("", attr, value, visual_range=[0, 200], visual_text_color="#fff",
symbol_size=15, is_visualmap=True)
geo.render("Python Map of Post City Distribution_scatter.html")
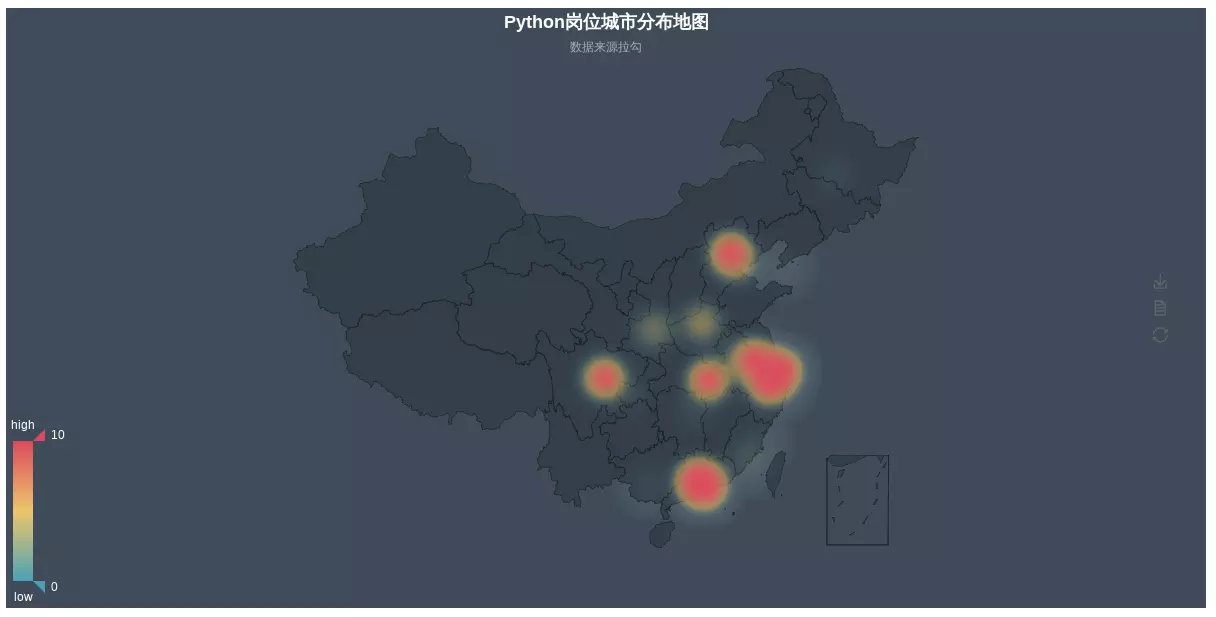
geo = Geo("Python Map of Post City Distribution", "Data Source Label", title_color="#fff",
title_pos="center", width=1200,
height=600, background_color='#404a59')
attr, value = geo.cast(city_datas)
geo.add("", attr, value, type="heatmap", visual_range=[0, 10], visual_text_color="#fff",
symbol_size=15, is_visualmap=True)
geo.render("Python Map of Post City Distribution_heatmap.html")
- Recruitment in various cities
What I don't know in the process of learning can be added to me?
python learning communication deduction qun, 784758214
 There are good learning video tutorials, development tools and e-books in the group.
Share with you the current talent needs of python enterprises and how to learn python from zero foundation, and what to learn
from pyecharts import Pie

city_nms_top10= ['Beijing','Shanghai','Shenzhen','Chengdu','Guangzhou','Hangzhou','Wuhan','Nanjing','Suzhou','Zhengzhou']
city_nums_top10 = [149, 95, 77, 22, 17, 17, 16, 13, 7, 5]
pie = Pie()
pie.add("", city_nms_top10, city_nums_top10, is_label_show=True)
# pie.show_config()
pie.render('Python post distribution pie chart. html')
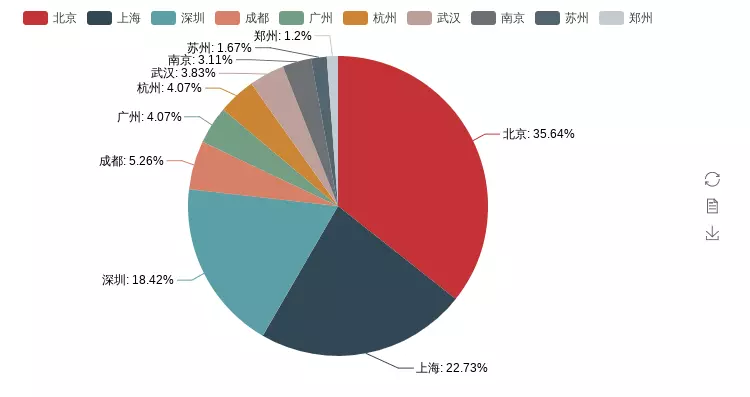
This also reflects why more and more IT practitioners go to first-tier cities one after another after graduation. Apart from the fact that the salary of first-tier cities is higher than that of second-tier and third-tier cities, the most important reason is the relationship between supply and demand. Because there are many first-tier jobs, the selectivity is higher. Looking at the situation on the second and third fronts, it is very likely that you will jump several times and find that companies in the same industry who can stay have stayed.
-
salary range
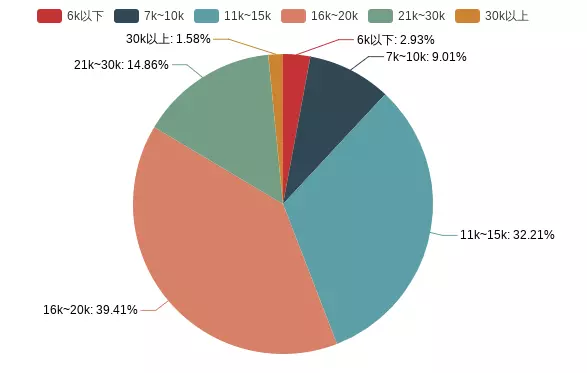
It can be seen that most of python's salaries are in the range of 10K to 20k. If you want to work in the Python industry, you can refer to the combination of working life and salary.
-
Education Requirements + Years of Work
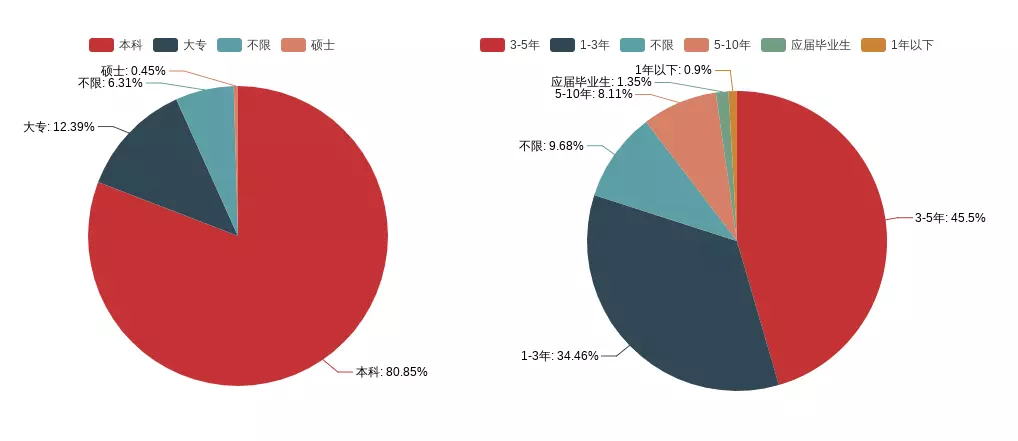
Judging from the length of work, there are many recruits with working experience of 1-3 or 3-5 years, but few new students and less than one year. They are not very friendly to interns, and their academic qualifications generally require undergraduate courses. Most companies attach great importance to the qualifications of entry personnel. Although academic qualifications do not represent everything, it is undoubtedly true for an enterprise. For industry, the quickest and most effective way to judge a person's ability in a short period of time is undoubtedly to start with education. Education level is the first level, interview level is the second level.
However, this does not mean that people with low academic qualifications do not have a good way out. Nowadays, more and more college students are finding jobs. it is more and more difficult to find jobs. Competition is becoming fiercer and fiercer. Even if you have high academic qualifications, you can not guarantee that you can find satisfactory jobs. God pays for your diligence, especially in the it industry. Iteration of knowledge is more important than other industries. More frequent. Constantly learning, expanding the breadth and depth of their own learning, is the most correct decision.
When the winter of employment comes, we need a rational and objective view, not blindly pessimistic or optimistic. From the above data analysis, if you like Python, you can still get into the pit, but you should pay attention to a label with work experience, even if you have no work experience, you must try to do a complete project independently in the process of learning Python, crawlers, data analysis, or development, and try to be independent. Do a system, in the process of training their ability to think and solve problems. Continuous learning is the best investment in your future and the most correct posture to spend the winter.