Python 3 Data Science Summary: https://blog.csdn.net/weixin_41793113/article/details/99707225
import numpy as np
import pandas as pd
from pandas import Series, DataFrame
data = {
'Country': ['China', 'India', 'Brazil'],
'Capital': ['Beijing', 'New Delhi', 'Brasilia'],
'Population': ['1432732201', '1303171635', '207847528']
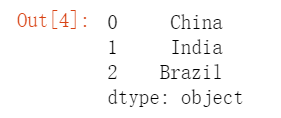
} #python dictionarys1 = Series(data['Country'])
s1
s2 = Series(data['Capital'])
s3 = Series(data['Population'])
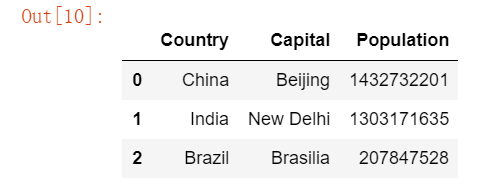
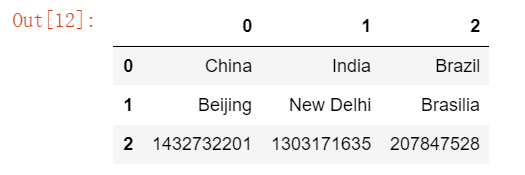
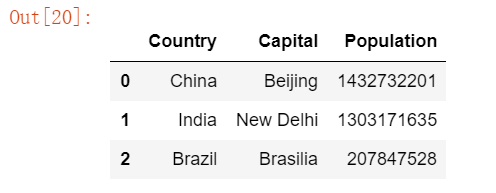
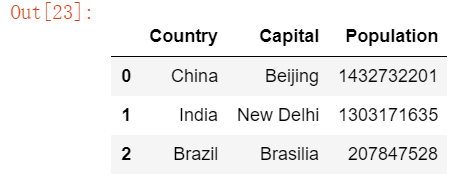
df = DataFrame(data) #DataFrame can be understood as a multi-column Series
df
for row in df.iterrows():
    print(row) #Iterator traverses each line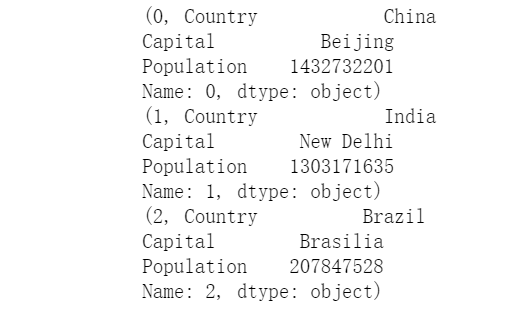
for row in df.iterrows():
    print(row[0], '+', row[1]) #[0] is the index [1] is the value
    break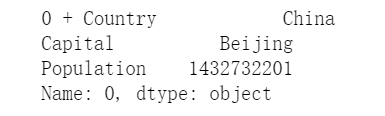
# Creating DataFrame through Series
df_new = DataFrame([s1,s2,s3])
df_new
df #The difference lies in listing.
df_new = DataFrame([s1,s2,s3], index=['Country','Capital', 'Population'])
#Solve the above column name problem and pass in the index
df_new
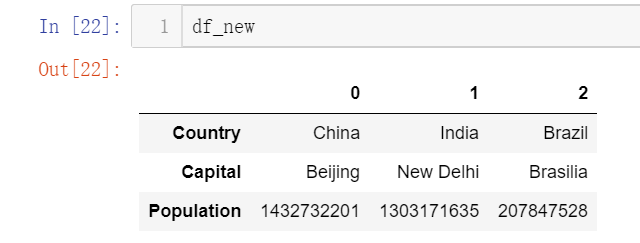
# It can be found that it is superimposed by line and needs to be transposed
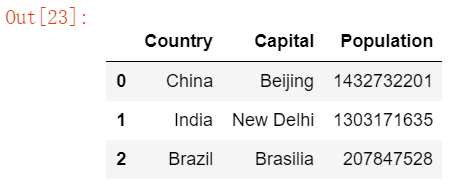
df_new.T
# Detailed description of the basic attributes of Pandas DataFrame
List of Basic Functions
import pandas as pd import library
df = pd.DataFrame(data=None, index=None, columns=None, dtype=None, copy=False)
Create a DataFrame
| Code | function | |
|---|---|---|
| 1 | DataFrame() | Create a DataFrame object |
| 2 | df.values | Returns an object of type ndarray |
| 3 | df.index | Get row index |
| 4 | df.columns | Get column index |
| 5 | df.axes | Get row and column indexes |
| 6 | df.T | Row-column alignment |
| 7 | df. info() | Print the information of the DataFrame object |
| 8 | df.head(i) | Display the first i-line data |
| 9 | df.tail(i) | Display post-i row data |
| 10 | df.describe() | View column-by-column statistics of data |
1. Create a DataFrame
The value of the parameter index of the DataFrame() function corresponds to the value of the row index. If it is not assigned manually, it will be allocated from 0 by default. columns are equivalent to column indexes, and if you do not assign them manually, they will be assigned from 0 by default.
data = {
        'Gender':['male','female','female','male','male'],
        'Full name':['Xiao Ming','Xiaohong','Xiaofang','Big black','Zhang San'],
        'Age':[20,21,25,24,29]}
df = pd.DataFrame(data,index=['one','two','three','four','five'],
               columns=['Full name','Gender','Age','Occupation'])
df
Operation results: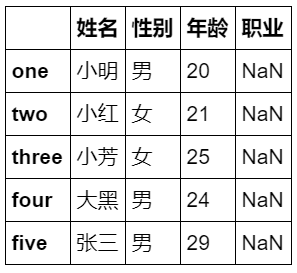
2. df.values returns objects of type ndarray
The ndarray type, numpy's N-dimensional array object, usually converts data of DataFrame type to ndarray type, which is easy to operate. For example, slicing a DataFrame type requires the form of df. iloc [:, 1:3], and directly X [:, 1:3] for the array type.
X = df.values
print(type(X)) #Display data type
X
3. df.index to get row index
df.index
Operation results:
Index(['one', 'two', 'three', 'four', 'five'], dtype='object')
4. df.columns retrieves column indexes
df.columns
Operation results:
Index(['Full name', 'Gender', 'Age', 'Occupation'], dtype='object')
5. df.axes retrieves row and column indexes
df.axes
Operation results:
[Index(['one', 'two', 'three', 'four', 'five'], dtype='object'),
 Index(['Full name', 'Gender', 'Age', 'Occupation'], dtype='object')]
- 1
- 2
6. df.T index and columns alignment
df.T
Operation results: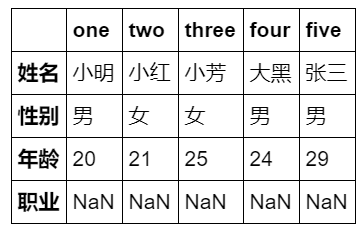
7. df.info () Print the information of the DataFrame object
df.info()
Operation results:
<class 'pandas.core.frame.DataFrame'>
Index: 5 entries, one to five
Data columns (total 4 columns):
//Name 5 non-null object
//Gender 5 non-null object
//Age 5 non-null int64
//Occupation 0 non-null object
dtypes: int64(1), object(3)
memory usage: 200.0+ bytes
8.df.head(i) displays the first i-line data
df.head(2)
Operation results: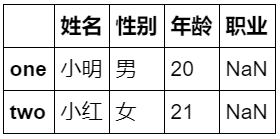
If you want to display the first few columns of data, you can use df.T.head(i)
9. df.tail(i) post-display i-line data
df.tail(2)
Operation results: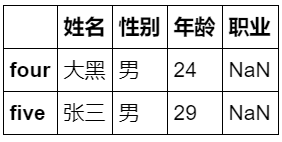
10. df.describe() view statistics by column
Information such as number of data, missing value, minimum and maximum number, average value, quantile can be displayed.