In the development process, we encountered such a problem:
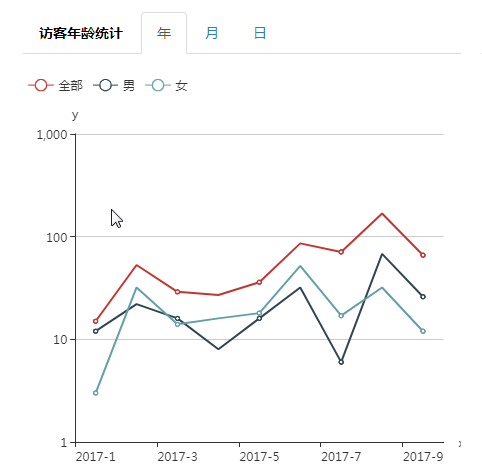
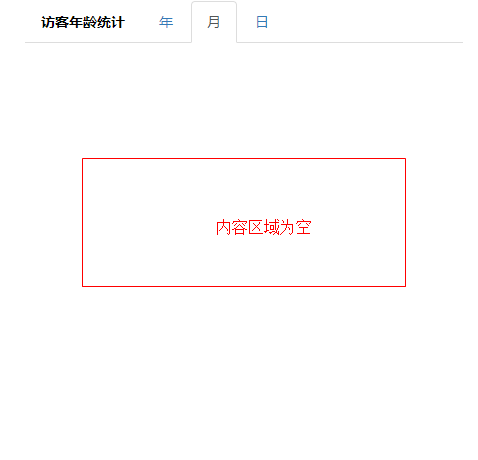
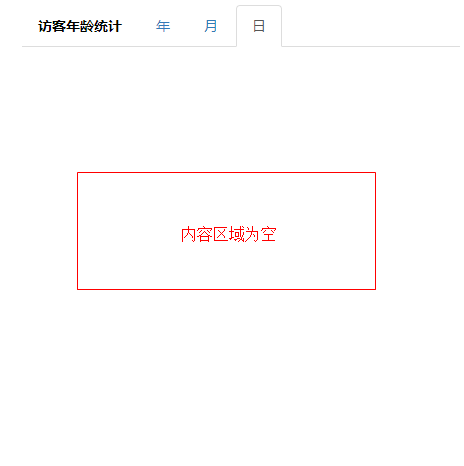
Using the tab bar in bootstrap, echats only renders the content of the first tab whenever the navigation of the tab bar is clicked, and when the tab is switched, the echats chart is not displayed.
Its html code is:
 1 <div class="col-xs-6" style="padding:10px;">
 2   <ul class="nav nav-tabs" id="myTab1">
 3      <li><a href="##" style="font-weight: 700;color:black;">Visitor Age Statistics</a></li>
 4      <li class="active"><a href="#home11" data-id="0">year</a></li>
 5      <li><a href="#home12" data-id="1">month</a></li>
 6      <li><a href="#home13" data-id="2">day</a></li>
 7   </ul>
 8   <div class="tab-content">
 9      <div class="tab-pane active" id="home11">
10         <!-- echarts container -->
11        <div class="chart">
12           <div id="main_11" style="height:400px;"></div>
13        </div>
14      </div>
15      <div class="tab-pane" id="home12">
16        <div class="chart">
17           <div id="main_12" style="height:400px;"></div>
18        </div>
19      </div>
20      <div class="tab-pane" id="home13">
21        <div class="chart">
22           <div id="main_13" style="height:400px;"></div>
23        </div>
24      </div>
25    </div>
26 </div>
The js code is:
 1 var myChart11 = echarts.init(document.getElementById('main_11'));
 2 var myChart12 = echarts.init(document.getElementById('main_12'));
 3 var myChart13 = echarts.init(document.getElementById('main_13'));
 4 // Specify the configuration items and data for the chart
 5 option = {
 6   title: {
 7     text: '',
 8     left: 'center'
 9   },
10   tooltip: {
11     trigger: 'item',
12     formatter: '{a} <br/>{b} : {c}'
13   },
14   legend: {
15     left: 'left',
16     data: ['whole', 'male', 'female']
17   },
18   xAxis: {
19     type: 'category',
20     name: 'x',
21     splitLine: { show: false },
22     data: ['2017-1', '2017-2', '2017-3', '2017-4', '2017-5', '2017-6', '2017-7', '2017-8', '2017-9']
23   },
24   grid: {
25     left: '3%',
26     right: '4%',
27     bottom: '3%',
28     containLabel: true
29   },
30   yAxis: {
31     type: 'log',
32     name: 'y'
33   },
34   series: [
35     {
36       name: 'whole',
37       type: 'line',
38       data: [15, 53, 29, 27, 36, 86, 71, 168, 66]
39     },
40     {
41       name: 'male',
42       type: 'line',
43       data: [12, 22, 16, 8, 16, 32, 6, 68, 26]
44     },
45     {
46       name: 'female',
47       type: 'line',
48       data: [3, 32, 14, 16, 18, 52, 17, 32, 12]
49     }
50   ]
51 };
52 // Use the configuration items and data just specified to display the chart.
53 myChart11.setOption(option);54 myChart12.setOption(option);55 myChart13.setOption(option);
The result of this code is shown by the picture above. After searching, it is found that the width of echats chart corresponding to "month" and "day" is 0, and it is not drawn in the corresponding box at all, that is to say, there is no rendering at all.
Later, after searching the data, we found a way to solve this problem, that is, to register the "show.bs.tab" event in the navigation bar of the tab bar, and to render each echats in the event.
 1  var arr=[];
 2  var myChart11 = echarts.init(document.getElementById('main_11'));
 3  var myChart12 = echarts.init(document.getElementById('main_12'));
 4  var myChart13 = echarts.init(document.getElementById('main_13'));
 5  // Specify the configuration items and data for the chart
 6  option = {
 7    title: {
 8      text: '',
 9      left: 'center'
10     },
11    tooltip: {
12      trigger: 'item',
13      formatter: '{a} <br/>{b} : {c}'
14    },
15    legend: {
16      left: 'left',
17      data: ['whole', 'male', 'female']
18    },
19    xAxis: {
20      type: 'category',
21      name: 'x',
22      splitLine: { show: false },
23      data: ['2017-1', '2017-2', '2017-3', '2017-4', '2017-5', '2017-6', '2017-7', '2017-8', '2017-9']
24    },
25    grid: {
26      left: '3%',
27      right: '4%',
28      bottom: '3%',
29      containLabel: true
30    },
31    yAxis: {
32      type: 'log',
33      name: 'y'
34    },
35    series: [
36      {
37        name: 'whole',
38        type: 'line',
39        data: [15, 53, 29, 27, 36, 86, 71, 168, 66]
40      },
41      {
42        name: 'male',
43        type: 'line',
44        data: [12, 22, 16, 8, 16, 32, 6, 68, 26]
45      },
46      {
47        name: 'female',
48        type: 'line',
49        data: [3, 32, 14, 16, 18, 52, 17, 32, 12]
50      }
51    ]
52  };
53  // Use the configuration items and data just specified to display the chart.
54  myChart11.setOption(option);
55  arr.push(myChart11);
56  myChart12.setOption(option);
57  arr.push(myChart12);
58  myChart13.setOption(option);
59  arr.push(myChart13);
60  // to tab Navigation button registers events for rendering
61  $('#myTab1 li a').on('shown.bs.tab', function (e) {
62    for (var i = 0; i < arr.length; i++) {
63      arr[i].resize();
64    }
65  });
66  // Rendering when the browser window size changes
67  $(window).resize(function () {
68     for (var i = 0; i < arr.length; i++) {
69       arr[i].resize();
70    }
71  });
The above problem can be solved by simply adding an array to which the box method to be rendered is added. When the event is triggered, these methods can be called again by traversing the array.