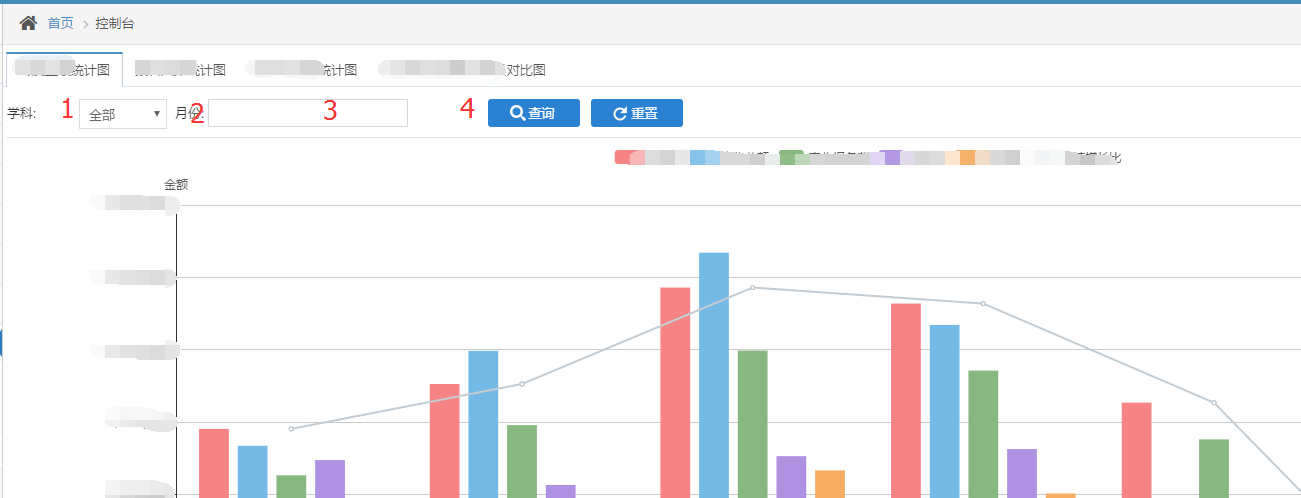
Recently, I encountered a problem in the development. In one page, I need to draw four charts, four tab s to switch to view, as shown below.

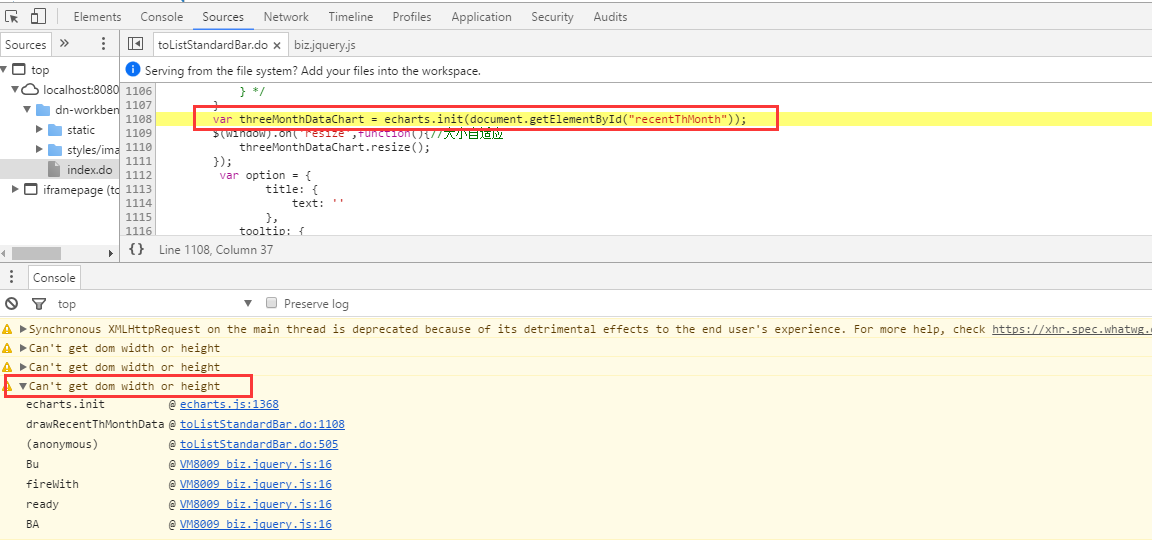
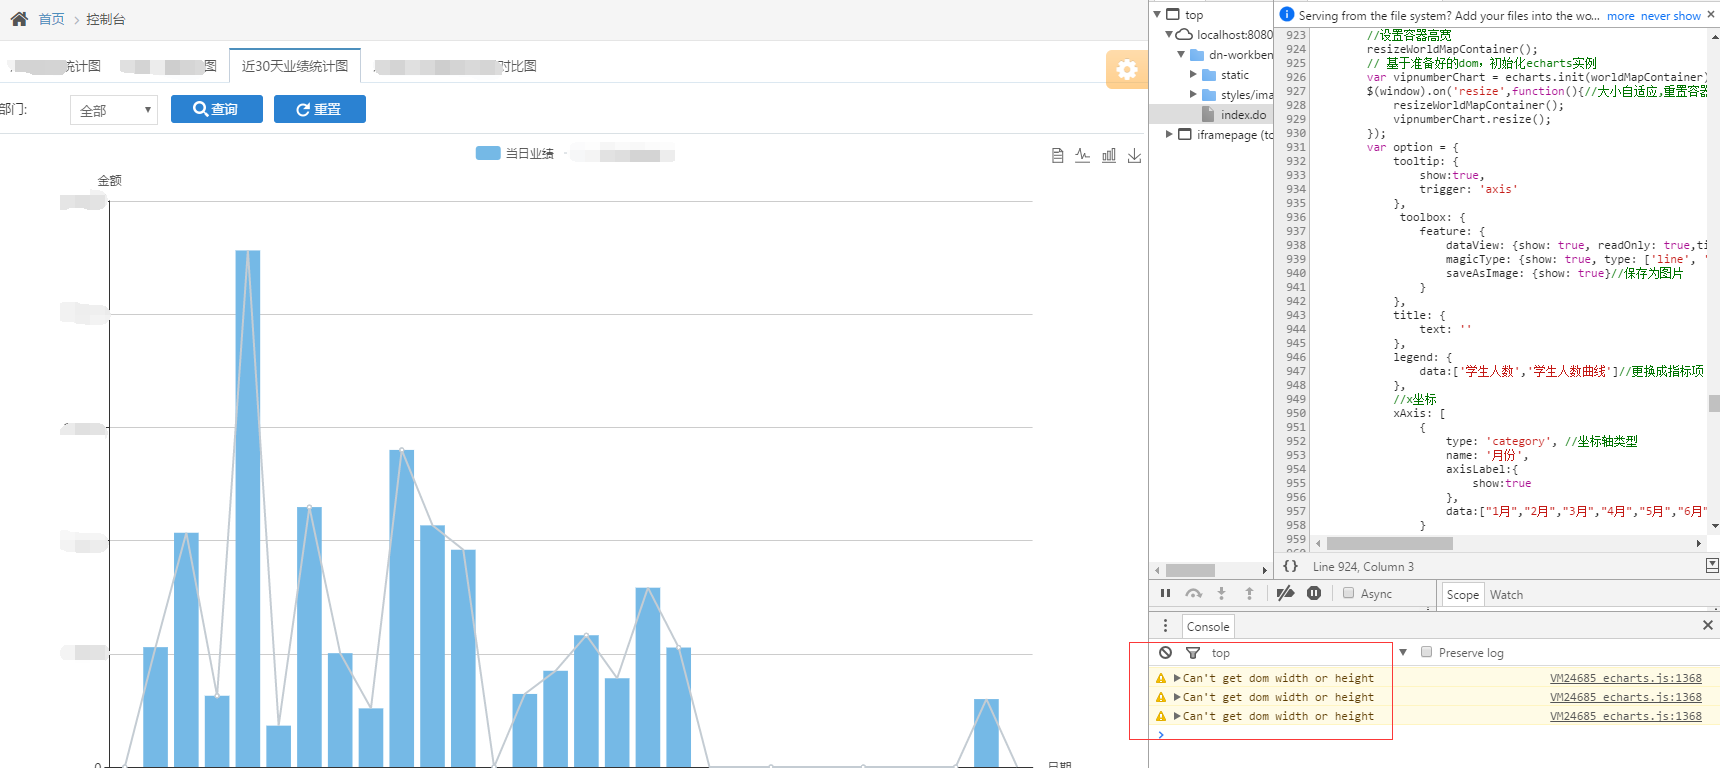
When the code is finished and the effect is checked, a problem is found. Only the first chart is successfully drawn and the width and height can be adaptively changed. The last three are blank. Look at the error message, as shown in the following figure

The guess may be that the init() method was executed incorrectly and the width of the div could not be obtained before rendering failed.
Solution: Just focus on the key code in the middle of the dotted line
function drawMainChart(){
        //initialize variable
        var names = [];
        var actualPay = []
        var allCome = [];
        var shouldPay = [];
        var profit = [];
        var pay = [];
        if(arr.length>0){
            for(var key in arr[0]){
                names.push(key);
            }
            names.sort(function compare(v1,v2){
                return  v1.split("-")[0]==v2.split("-")[0]?v1.split("-")[1]-v2.split("-")[1]:v1.split("-")[0]>v2.split("-")[0];
            });
            var name;
            for(var j=0;j<names.length;j++){
                name = arr[0][names[j]];
                if(name){
                    actualPay.push(Math.round(name.xfsr));
                    allCome.push(Math.round(name.xfbk+name.xfsr));
                    shouldPay.push(Math.round(name.shouldPay));
                    profit.push(Math.round(name.xfbk+name.xfsr-name.pay));
                    pay.push(Math.round(name.pay));
                }else{
                    actualPay.push(0);allCome.push(0);profit.push(0);pay.push(0);shouldPay.push(0);
                }
            }
        }
        --------------------------------------------------------------------------------
        var mainContainer = document.getElementById('main');
        //Used to make chart adaptive height and width, calculate container height and width by form height and width
        var resizeMainContainer = function () {
            mainContainer.style.width = window.innerWidth+'px';
            mainContainer.style.height = window.innerHeight*0.8+'px';
        };
        //Setting the height and width of div container
        resizeMainContainer();
        // Initialization chart
        var mainChart = echarts.init(mainContainer);
        $(window).on('resize',function(){//
            //Screen size adaptive, reset container height and width
            resizeMainContainer();
            mainChart.resize();
        });
        --------------------------------------------------------------------------------
        var option = {
            tooltip: {
                show:true,
                trigger: 'axis'
            },
             toolbox: {
                feature: {
                    dataView: {show: true, readOnly: true,title:'Data view'},
                    magicType: {show: true, type: ['line', 'bar']},
                    saveAsImage: {show: true}//Save as a picture
                }
            },
            title: {
                text: ''
            },
            legend: {
                data:['Total performance','Total receivables','Collection of registration fee','total cost','Gross profit','Performance growth ratio']
            },
            //x coordinates
            xAxis: [
                {
                    type: 'category', //Type of coordinate axis
                    name: 'Month',
                    axisLabel:{
                        show:true
                    },
                    data:  names //Change to dynamic data in the last six months
                }
            ],
            //y coordinates
            yAxis: {
                type: 'value',
                name: 'Amount of money',
                min: 0,
                axisLabel: {
                    formatter: '$ {value}'
                }
            },
            series: [{
                    name: 'Total performance',
                    type: 'bar',
                    data: allCome //Replace with dynamic data
                },
                {
                    name:'Total receivables',
                    type:'bar',
                    data:shouldPay //Replace with dynamic data
                },
                {
                    name:'Collection of registration fee',
                    type:'bar',
                    data:actualPay //Replace with dynamic data
                },
                {
                    name:'total cost',
                    type:'bar',
                    data:pay //Replace with dynamic data
                },
                {
                    name:'Gross profit',
                    type:'bar',
                    data:profit //Replace with dynamic data
                },
                {
                    name:'Performance growth ratio',
                    type:'line',
                    data:allCome //Replace with dynamic data
                }
            ],
            color:['#f68484',  '#75b9e6', 'rgb(135, 184, 127)','#ae91e1', '#f6ac61', '#c4ccd3'],
        }
        mainChart.setOption(option);
}- var resizeMainContainer = function () {
mainContainer.style.width = window.innerWidth+'px';
mainContainer.style.height = window.innerHeight*0.8+'px';
}; - $(window).on('resize',function(){//
// Screen size adaptive, reset container height and width
resizeMainContainer();
mainChart.resize();
});
Through the above two methods, we can manually give the container div width and height, and successfully draw the chart.

But there's Warning: Can't get dom width or height!
