Preliminary understanding of zabbix:
Zabbix can monitor various network parameters to ensure the safe operation of the server system, and provide a flexible notification mechanism to enable system administrators to quickly locate/solve various problems. It is an enterprise-level open source solution based on WEB interface to provide distributed system monitoring and network monitoring functions. The monitored object can only support SNMP protocol or run zabbix_agents agent.
Agent side: The host collects data by installing agent.
server side: collect data sent by agent, write to database (MySQL, ORACLE, etc.), and then display it on the front end of the web through php+apache.
SNMP:
SNMP is the abbreviation of "Simple Network Management Protocol" in English, which means "Simple Network Management Protocol" in Chinese. SNMP is a simple network management protocol, which belongs to the application layer protocol of TCP/IP five-layer protocol and is used for network management. SNMP is mainly used for network equipment management.
The working principle of zabbix is as follows:
Agentd is installed on the monitored host. Agent is responsible for collecting the local data of client and sending it to Zabbix Server. Zabbix Server receives the data and stores it in the database. Users can see the data display image on the front end based on Zabbix WEB. When Zabbix monitors a specific project, the change project sets a trigger threshold. When the monitored target exceeds the threshold set by the trigger, some necessary actions will be taken, including sending information (e-mail, micro-message, short message), sending commands (SHELL command, Reboot, Restart, Install, etc.).
The five important components of zabbix are:
1. Zabbix Server: The core component responsible for receiving the report information sent by the agent. All configuration, statistical data and operational data are organized by the agent.
2. Database Storage: dedicated to storing all configuration information and data collected by zabbix;
3. Web interface: the GUI interface of zabbix, usually running on the same host as Server;
4. Proxy: Optional components, often used in distributed monitoring environment, proxy Server collects some monitoring data from the monitored end and sends them to the server end uniformly.
5. Agent: Deployed on the monitored host, responsible for collecting local data and sending it to Server or Proxy.
zabbix Basic Component Topology: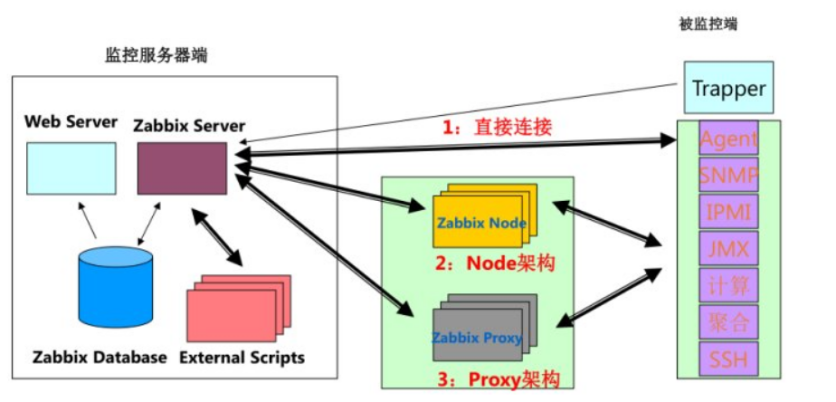
Now I'll configure in detail how to deploy zabbix
The experimental environment:
STKAITI font file links: https://pan.baidu.com/s/1EC_jdOhRGjDJewAKueaTUg
Extraction code: zmv4
I. Deployment of LAMP Architecture
Download the installation packages required for LAMP
[root@localhost ~]# yum install httpd mariadb mariadb-server php php-mysql php-gd libjpeg* php-ldap php-odbc php-pear php-xml php-xmlrpc php-mhash -y
Configure Apache Master Profile
[root@localhost ~]# vim /etc/httpd/conf/httpd.conf
ServerName www.yun.com:80 #Modify domain name
DirectoryIndex index.html index.php #Let Apache support PHP
To connect zabbix to the internet, set up a time zone in China
[root@localhost ~]# vim /etc/php.ini
date.timezone = PRC
Open httpd service and mysql
[root@localhost ~]# systemctl start httpd.service
[root@localhost ~]# systemctl start mariadb.service
[root@localhost ~]# netstat -ntap | egrep '80|3306'            #View ports for two services
tcp        0      0 0.0.0.0:3306            0.0.0.0:*               LISTEN      38513/mysqld
tcp6       0      0 :::80                   :::*                    LISTEN      38242/httpd
Reconfiguration of mariadb database parameters
[root@localhost ~]# mysql_secure_installation
Set root password? [Y/n] y         #Whether to set a password or not
Remove anonymous users? [Y/n] n      #Whether to delete the default user
Disallow root login remotely? [Y/n] n      #Do you prohibit root remote login?
Remove test database and access to it? [Y/n] n        #Whether to delete the test database
Reload privilege tables now? [Y/n] y       #Is the database initialized?
Create zabbix database
[root@localhost ~]# mysql -uroot -p
MariaDB [(none)]> create database zabbix character set utf8 collate utf8_bin;    #Create a zabbix database
MariaDB [(none)]> grant all on zabbix.* to 'zabbix'@'%' identified by '123123';     #Create administrative users for the zabbix database
MariaDB [(none)]> flush privileges;
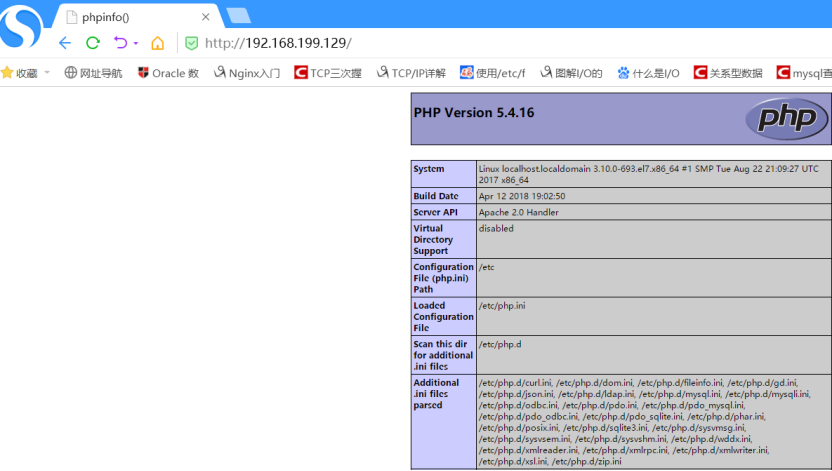
Create PHP Test Home Page
[root@localhost ~]# vim /var/www/html/index.php
<?php
  phpinfo();
?>
Write test scripts to test whether PHP can connect to the database
<?php
$link=mysql_connect('192.168.199.129','zabbix','123123');
if($link) echo "<h1>success</h1>";
else echo "fail";
mysql_close();
?>
Sometimes when using zabbix users to log in to the database, there will be login failure. This is because the local users can not log in because of the occupancy of empty users, so it is necessary to delete the empty users.
[root@localhost ~]# mysql -u zabbix -p         #Login failed
Enter password:
ERROR 1045 (28000): Access denied for user 'zabbix'@'localhost' (using password: YES)

[root@localhost ~]# mysql -u root -p
MariaDB [(none)]> select user,host from mysql.user;   #Empty User Occupancy Causes Local User Unable to Log in
+--------+-----------------------+
| user   | host                  |
+--------+-----------------------+
| zabbix | %                     |
| root   | 127.0.0.1             |
| root   | ::1                   |
|        | localhost             |
| root   | localhost             |
|        | localhost.localdomain |
| root   | localhost.localdomain |
+--------+-----------------------+
7 rows in set (0.00 sec)

MariaDB [(none)]> drop user ''@'localhost';         #Delete empty users
Query OK, 0 rows affected (0.01 sec)

MariaDB [(none)]> drop user ''@'localhost.localdomain';       #Delete empty users
Query OK, 0 rows affected (0.00 sec)

[root@localhost ~]# mysql -u zabbix -p      #Just log in again.
MariaDB [(none)]>
So far, the LAMP architecture has been deployed.
II. Deployment of zabbix server
[root@localhost ~]# yum install php-bcmath php-mbstring -y       #Download two PHP dependency packages
[root@localhost~]#rpm -ivh http://repo.zabbix.com/zabbix/3.5/rhel/7/x86_64/zabbix-release-3.5-1.el7.noarch.rpm# Download the source of zabbix yum, and repo files will be generated automatically after installation.
[root@localhost ~]# yum install zabbix-server-mysql zabbix-web-mysql -y    #Install zabbix package
Modify the zabbix configuration file
[root@localhost ~]# grep -n '^'[a-Z] /etc/zabbix/zabbix_server.conf    #The following lines need to be modified
38:LogFile=/var/log/zabbix/zabbix_server.log
49:LogFileSize=0
72:PidFile=/var/run/zabbix/zabbix_server.pid
82:SocketDir=/var/run/zabbix
101:DBName=zabbix
117:DBUser=zabbix
125:DBPassword=123123     #Change password to zabbix login password
357:SNMPTrapperFile=/var/log/snmptrap/snmptrap.log
475:Timeout=4
518:AlertScriptsPath=/usr/lib/zabbix/alertscripts
529:ExternalScripts=/usr/lib/zabbix/externalscripts
565:LogSlowQueries=3000
[root@localhost ~]# vim /etc/httpd/conf.d/zabbix.conf    #Modify time zone
php_value date.timezone Asia/Shanghai

[root@localhost ~]# vim /usr/share/zabbix/include/defines.inc.php    #Correction of Chinese Scrambling in Charts
:%s /graphfont/kaiti/g     #Replace graphfont in the configuration file with kaiti
[root@localhost ~]# cp STKAITI.TTF /usr/share/zabbix/fonts/    #Copy font files from Microsoft to / usr/share/zabbix/fonts
Open the zabbix server
[root@localhost ~]# systemctl start zabbix-server.service
[root@localhost ~]# systemctl enable zabbix-server.service
[root@localhost ~]# netstat -ntap | grep 10051       #View port
tcp        0      0 0.0.0.0:10051           0.0.0.0:*               LISTEN      40703/zabbix_server
tcp6       0      0 :::10051                :::*                    LISTEN      40703/zabbix_server

[root@localhost ~]# systemctl restart httpd.service     #Restart Apache Service

http://192.168.199.129/zabbix #Log on to the ZABBIX page on the browser
The first thing you see is the version of zabbix: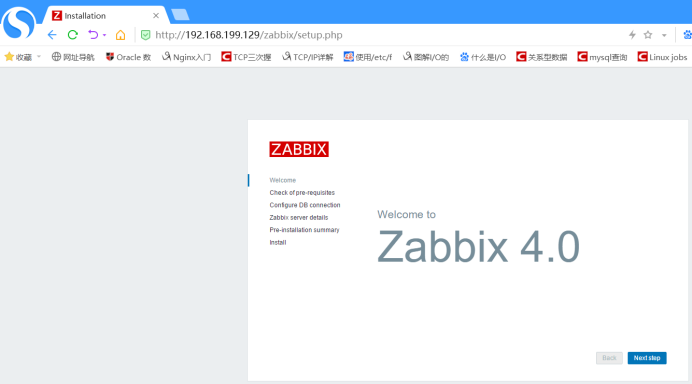
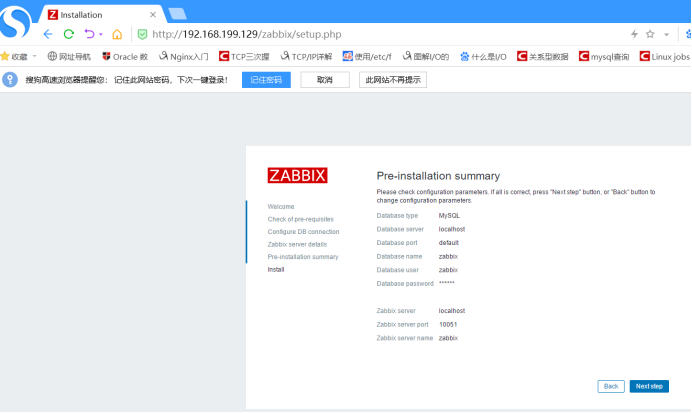
All options here are OK to indicate that configuration is okay: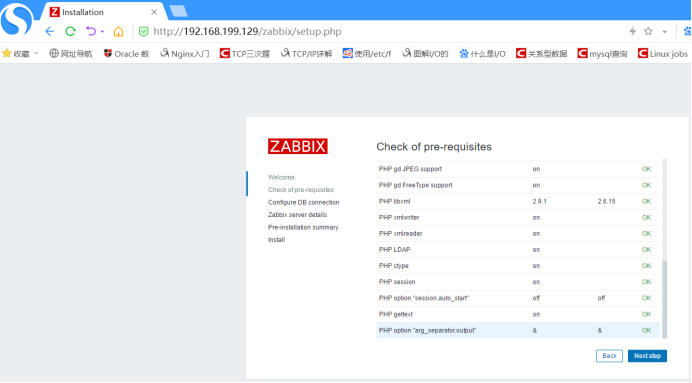
The login password with the password zabbix: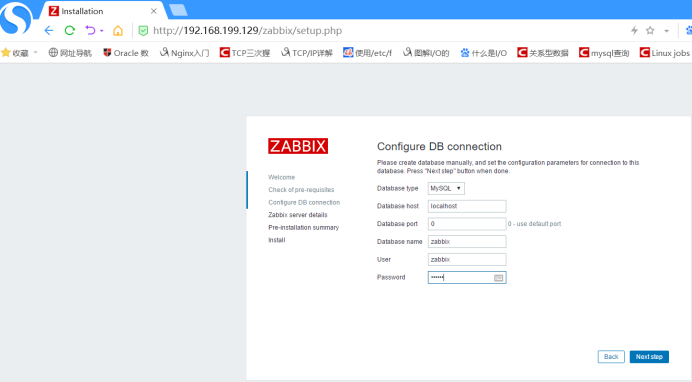
Name zabbix: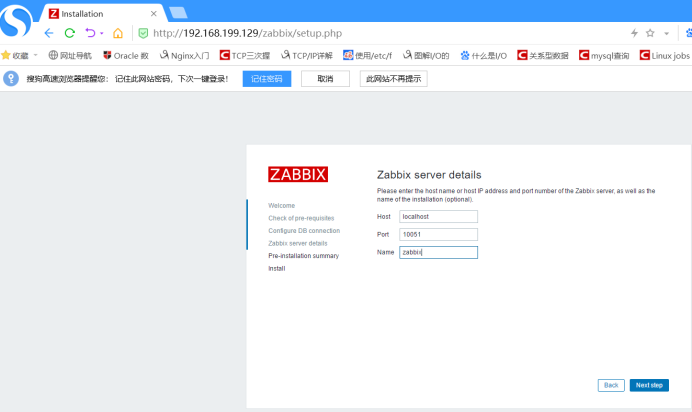
The default username and password are Admin and zabbix: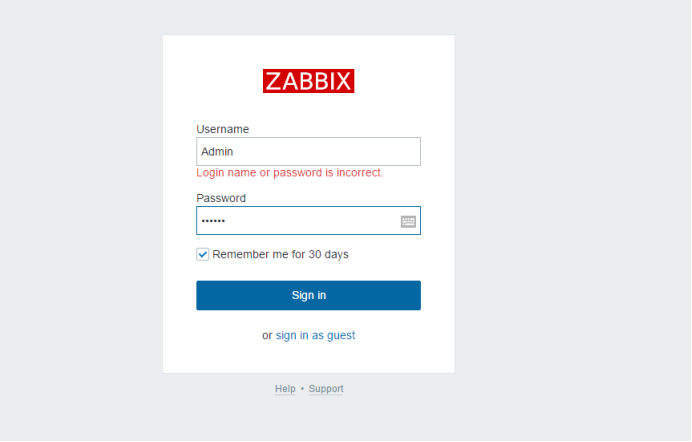
After the login is completed, you will go to the monitoring page of zabbix: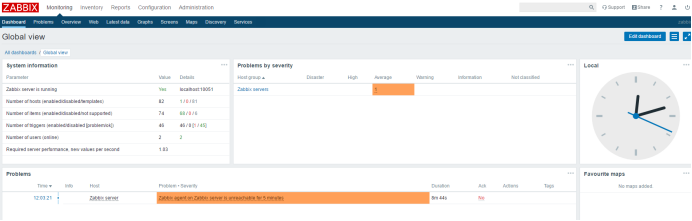
Click on the head image in the upper right corner to choose the language. Here I choose Chinese: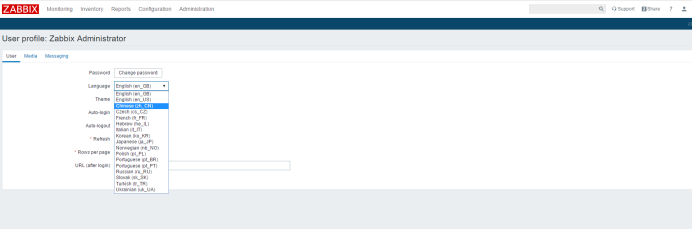
Installation of monitored end
[root@localhost ~]# systemctl stop firewalld.service     #Close the firewall
[root@localhost ~]# setenforce 0
[root@localhost~]#rpm -ivh http://repo.zabbix.com/zabbix/3.5/rhel/7/x86_64/zabbix-release-3.5-1.el7.noarch.rpm#Download yum source
[root@localhost ~]# yum install zabbix-agent -y   #The monitored end needs to install the agent package. If you want to monitor the machine, you can also install it on the monitoring server.
Change configuration file
[root@localhost ~]# grep -n '^'[a-Z] /etc/zabbix/zabbix_agentd.conf    #Change the following options for configuration files
13:PidFile=/var/run/zabbix/zabbix_agentd.pid
32:LogFile=/var/log/zabbix/zabbix_agentd.log
43:LogFileSize=0
98:Server=192.168.199.129     #Point the address to the server side
139:ServerActive=192.168.199.129     #Point the address to the server side
150:Hostname=test     #Names are self-defining
268:Include=/etc/zabbix/zabbix_agentd.d/*.conf
Opening service
[root@localhost ~]# systemctl start zabbix-agent.service
[root@localhost ~]# systemctl enable zabbix-agent.service
Created symlink from /etc/systemd/system/multi-user.target.wants/zabbix-agent.service to /usr/lib/systemd/system/zabbix-agent.service.
[root@localhost ~]# netstat -ntap | grep zabbix     #View port
tcp        0      0 0.0.0.0:10050           0.0.0.0:*               LISTEN      40351/zabbix_agentd
tcp6       0      0 :::10050                :::*                    LISTEN      40351/zabbix_agentd
Once configured on the server, you can configure it on the zabbix monitoring page.
First add the monitored server to the monitoring page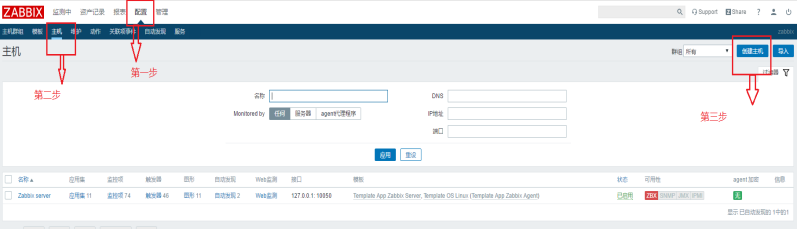
Configuring basic information for host items
Configure template options and add modules you want to monitor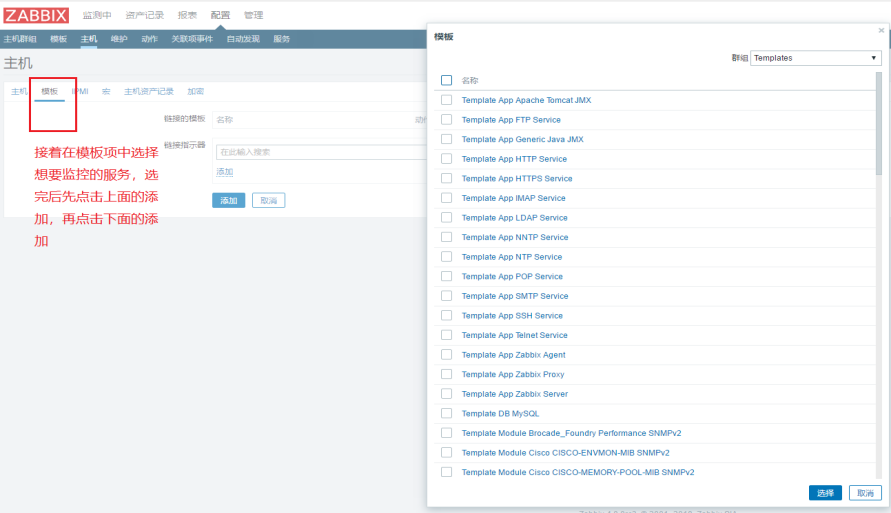
View the added host information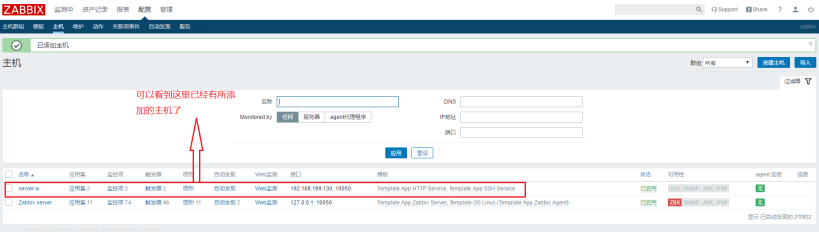
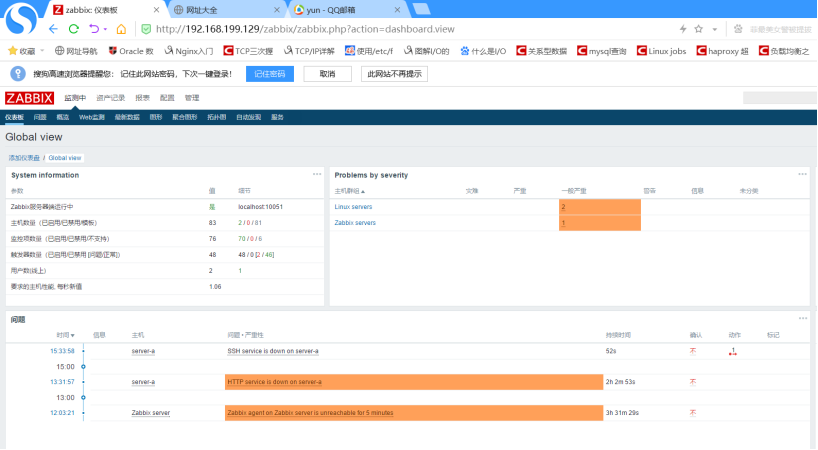
Back to the main interface, click refresh, and the monitoring information will appear in a moment.
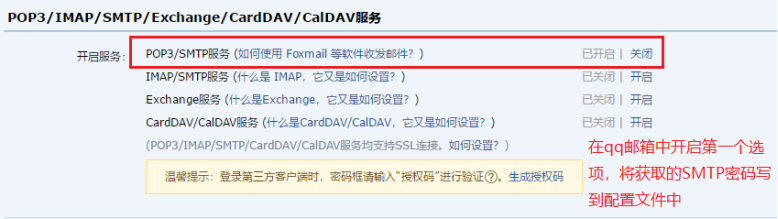
4. Configuration of Email Alarm Function--Configuration on Monitoring Server
[root@localhost ~]# yum install mailx -y       #Download Mailbox Service
[root@localhost ~]# vim /etc/mail.rc        #Add the following configuration at the end of the file
set from=E-mail address
set smtp=smtp.qq.com
set smtp-auth-user=E-mail address
set smtp-auth-password=**********     #If you fill in the qq mailbox, the password is the SMTP password of the qq mailbox.
set smtp-auth=login
[root@localhost ~]# systemctl restart postfix.service    #Restart Mailbox Service

[root@localhost ~]# echo "hello world" | mail -s "testmail" E-mail address   #Send a test email
You can see that I received an email in QQ mailbox.
[root@localhost ~]# vim /usr/lib/zabbix/alertscripts/mail.sh    #Write an email script. The script path must be right.
#!/bin/bash
#send mail

messages=`echo $3 | tr '\r\n' '\n'`
subject=`echo $2 | tr '\r\n' '\n'`
echo "${messages}" | mail -s "${subject}" $1 >>/tmp/mail.log 2>&1
[root@localhost ~]# chmod +x /usr/lib/zabbix/alertscripts/mail.sh #Give script execution privileges [root@localhost ~]# touch /tmp/mail.log #Create Mailbox Log Files [root@localhost ~]# chown -R zabbix.zabbix /tmp/mail.log #Give permissions to zabbix users [root@localhost ~]# chown -R zabbix.zabbix /usr/lib/zabbix/
Send a test email again using script execution
[root@localhost ~]# cd /usr/lib/zabbix/alertscripts/
[root@localhost alertscripts]# ./mail.sh E-mail address "yun" "hahahahaha"        #Sending format is "Address", "Title", "Content"

Configuration of zabbix mail alarm mechanism
1. Select the type of alarm media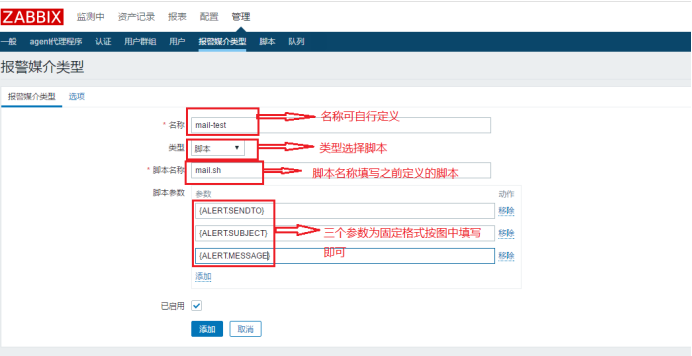

2. Select Management Users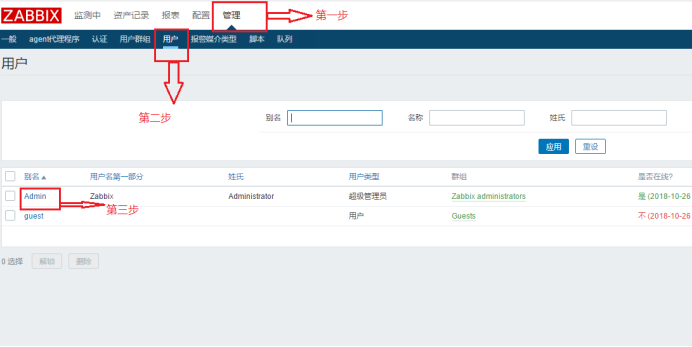


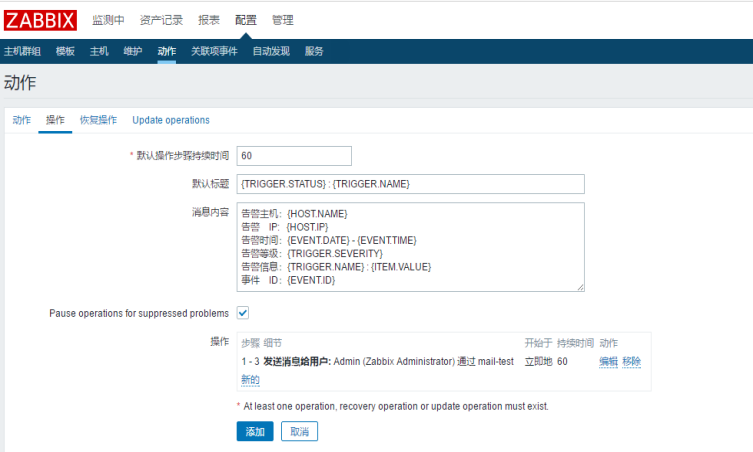
3 Define the sending form of alarm mail in action configuration item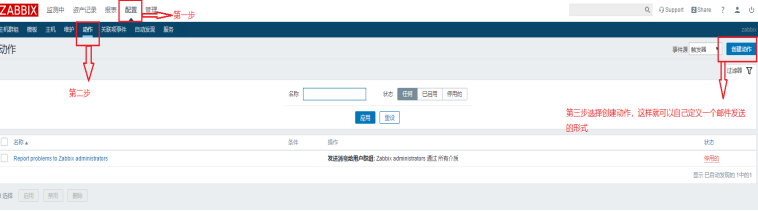


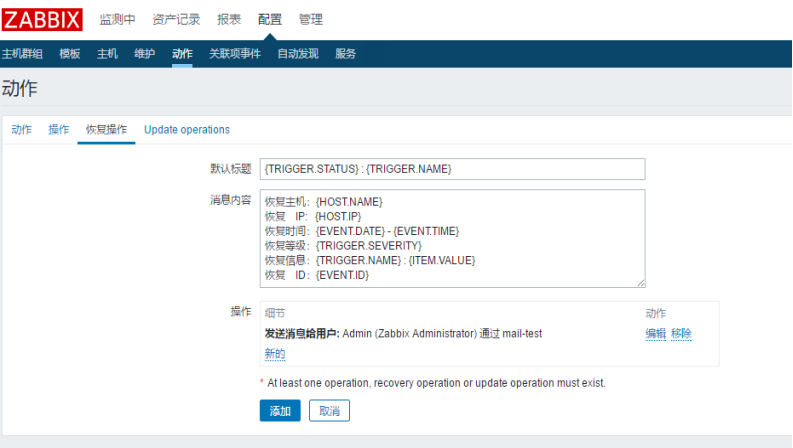
4. Configure the sending form of mail after recovery operation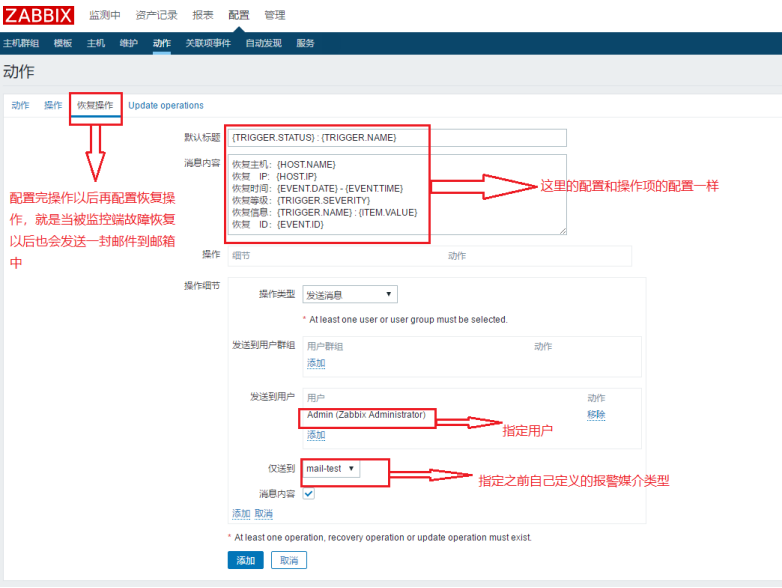
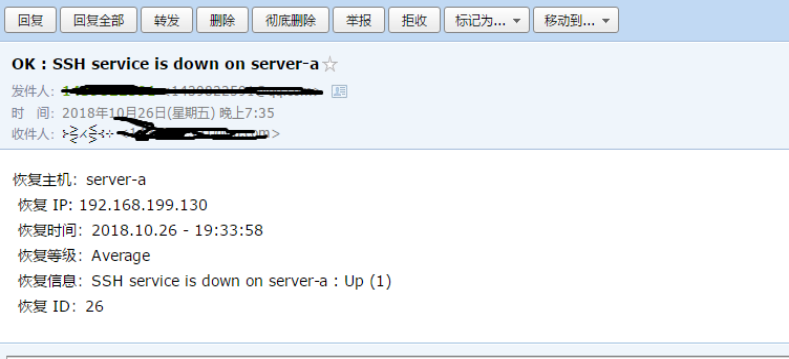
7. Test. If I shut down the monitored service to simulate service failure, one of the zabbix will send me an email reminding me that when I open the service again, it will indicate that the service has been repaired, and the other will send a recovery email.
[root@localhost ~]# systemctl stop sshd.service #Close the ssh service on the monitored end
Then you will receive an email message: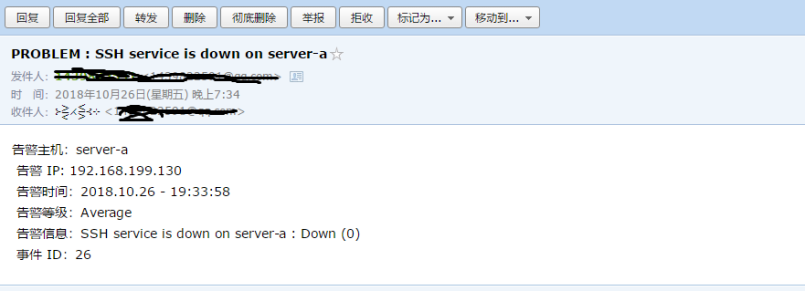
[root@localhost ~]# systemctl start sshd.service #Once again, I turn on SSH services on the monitored side
So far, the zabbix monitoring system has been built.