Before we start drawing, we need to say that the coordinate system used by Canvas is the W3C coordinate system.
The X-axis is directed to the right.
The Y axis is downward in the positive direction.
All drawing directions are based on this.
The coordinates in the upper left corner of Canvas are X:0; Y:0, although writing negative numbers does not cause errors, the default excess part of Canvas is not displayed;
As shown in the figure: 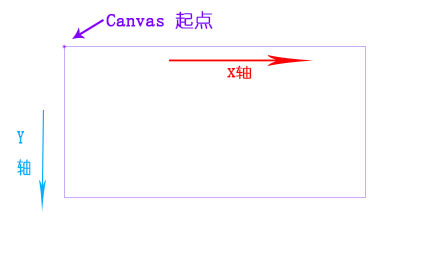
API for this chapter (focus on. Later on ^uuuuuuuuuuuuuu
1, straight line
ctx.moveTo(x1,y1);
ctx.lineTo(x2,y2); //Repeatable
ctx.stroke();
// Start drawing the desired graphics (you can imagine yourself taking a virtual brush and then manipulating it)
    ctx.moveTo(100,50);     //Move the brush to the coordinate position you want to start drawing, starting with the brush X axis coordinate 100 Y axis coordinate 50
    ctx.lineTo(700,50);      //Draw to stop coordinate position until X axis coordinate 700 Y axis coordinate 50 stop
    ctx.stroke();           //The last step is to determine, display
Design sketch: 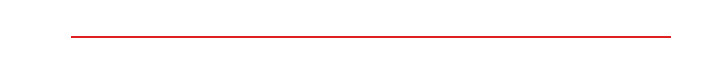
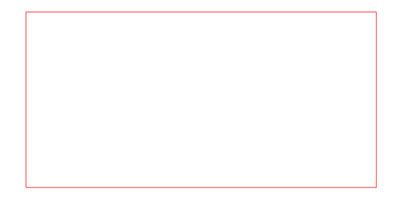
Here we draw a rectangle with a straight line.
ctx.strokeStyle = "#F00";       //Define the color of the brush
    ctx.moveTo(100,100);     //Pick up the brush and move it. Draw again from the brush X axis coordinate 100 Y axis coordinate 100.
    ctx.lineTo(700,100);      //Draw to stop coordinate position until X axis coordinate 700 Y axis coordinate 100
                            //lineTo personally feels like he's been drawing without lifting his brush.
    ctx.lineTo(700,400);      //Continue drawing to X axis coordinate 700 Y axis coordinate 400
    ctx.lineTo(100,400);      //Continue drawing to X axis coordinate 100 Y axis coordinate 400
    ctx.lineTo(100,100);      //Continue drawing to X axis coordinate 100 Y axis coordinate 100
    ctx.stroke();             //Completed, can be displayed
Design sketch:
2, rectangle
(Drawing rectangle)
ctx.strokeStyle = attribute value;
ctx.strokeRect(x,y,width,height);
!!! It should be noted that strokeStyle must be written before strokeRect or it will not be valid.
//Edge-drawing rectangle (Draw rectangle can consider using this, the effect of the above 7 sentences can be shown in 2 sentences can be done)
    ctx.strokeStyle = "#0695FF";        //Define the color of a rectangle
    ctx.strokeRect(200,150,200,150);    //Starting with the X axis coordinate 200 Y axis coordinate 150, draw a rectangle with a width of 200 and a height of 150.
Design sketch: 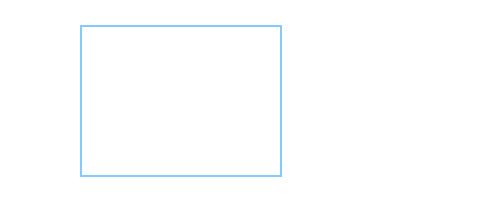
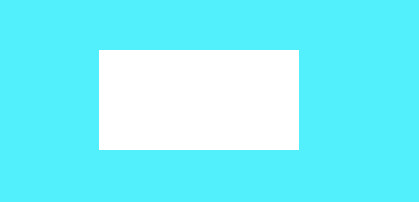
(Filling rectangle)
ctx.fillStyle = attribute value;
ctx.fillRect(x,y,width,height);
!!! Ibid., note that fillStyle must be written in fillRect or it will not work.
In addition, strokeStyle and fillStyle are attributes, strokeRect and fillRect are methods. This should be differentiated.
Understanding can be console.log() output console to take a look at the general understanding! (Chrome is recommended)
 //Filled rectangle
    ctx.fillStyle="#FF9BFA";
    ctx.fillRect(200,500,200,100);
Design sketch: 
There are actually several kinds of strokeStyle and fillStyle attribute values.
ctx.strokeStyle="#0695FF";
ctx.strokeStyle="red";
ctx.fillStyle="rgb(255,255,255)";
ctx.fillStyle="rgba(255,255,255,0.8)";
For example:
//Superposition of two rectangles
    ctx.fillStyle="rgba(255,155,250,0.5)";
    ctx.fillRect(500,500,100,100);

    ctx.fillStyle="rgba(95,211,255,0.5)";
    ctx.fillRect(550,550,100,100);
Design sketch: 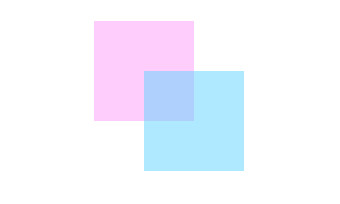
In addition to the two methods of drawing rectangles mentioned above, there is another method that can also be used:
ctx.rect(x,y,width.height);
Unlike strokeRect and fillRect, it needs to call stroke() or fill() again after each drawing to display.
//rect()
    ctx.strokeStyle="#f00";             //Tracing rectangle
    ctx.rect(50,600,100,100);
    ctx.stroke();

    ctx.fillStyle="#52F0FC";             //Filled rectangle
    ctx.rect(160,610,50,50);
    ctx.fill();
It should also be noted that without any treatment! Under the same Canvas, the fill() method fills all the previously unfilled graphics, which needs a little attention!
(Canvas is a drawing based on "state". Each stroke() or fill() detects all the states of the code and draws all the designs in the same path.
Solution: You can restart the path with beginPath() and so on, and then add it later.
Design sketch: 
The last thing about rectangles is to empty them:
ctx.clearRect(x,y,width,height);
ctx.clearRect(200,150,200,100); //Cleaning starts at X axis coordinate 200 Y axis coordinate 150, and is 200 wide and 100 high.Design sketch: