1. Monitoring nginx status by zabbix
Nginx has built-in a status state function, through configuration you can see the operation of nginx, status display includes the current number of connections, the number of active connections, the number of requests processed and so on. Here we use zabbix to monitor nginx services. The following is the configuration process:
agent terminal
server2:
1. Page View nginx Status
Unzip nginx rpm package
[root@server2 ~]# rpm -ivh nginx-1.8.0-1.el6.ngx.x86_64.rpm Edit nginx configuration file
[root@server2 ~]# cd /etc/nginx/conf.d/
[root@server2 conf.d]# vim default.conf
 13     location /status {
 14         stub_status     on;    #View some status information for Nginx
 15         access_log      off;   #No logs enabled
 16     #    allow 127.0.0.1;
 17     #    deny all;
 18     }
nginx grammar checking
[root@server2 conf.d]# nginx -tOpen nginx
[root@server2 conf.d]# nginxBrowser access 172.25.10.2/status
The number of requits increases with the number of refreshes 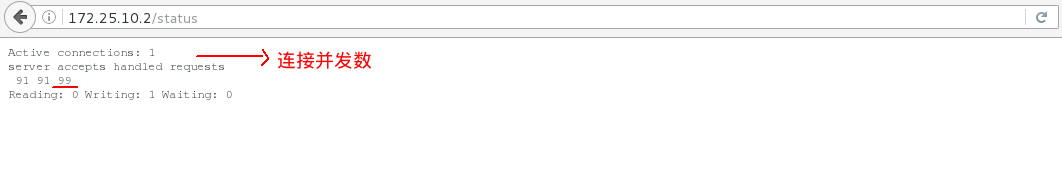
2. Writing agent-side monitoring script
Modifying the nginx configuration file allows only 127.0.0.1 access
[root@server2 conf.d]# vim default.conf
 13     location /status {
 14         stub_status     on;
 15         access_log      off;
 16         allow 127.0.0.1;
 17         deny all;
 18     }
 [root@server2 conf.d]# nginx -s reload
Testing:
curl http://127.0.0.1/status     ##Can access
curl http://172.25.10.2/status   ##Other hosts are not accessible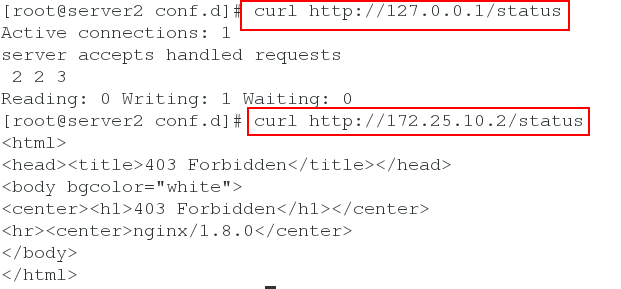
Filtering only looks at active concurrency
curl -s http://127.0.0.1/status | grep Active | awk '{print $NF}'Writing zabbix monitoring script on agent side
[root@server2 conf.d]# cd /etc/zabbix/zabbix_agentd.d/
[root@server2 zabbix_agentd.d]# cp userparameter_mysql.conf userparameter_nginx.conf
[root@server2 zabbix_agentd.d]# vim userparameter_nginx.conf
UserParameter=nginx.active,curl -s http://127.0.0.1/status | grep Active | awk '{print $3}'
UserParameter=nginx.accepts,curl -s http://127.0.0.1/status | awk NR==3 | awk '{print $1}'
UserParameter=nginx.handled,curl -s http://127.0.0.1/status | awk NR==3 | awk '{print $2}'
UserParameter=nginx.requests,curl -s http://127.0.0.1/status | awk NR==3 | awk '{print $3}'
Open the service after configuration
/etc/init.d/zabbix-agent start3. Zabbix server uses zabbix_get test to get data
server terminal
server1:
Open service
[root@server1 ~]# systemctl start mariadb
[root@server1 ~]# systemctl enable mariadb
[root@server1 ~]# systemctl start zabbix-server
[root@server1 ~]# systemctl enable zabbix-server
[root@server1 ~]# systemctl start zabbix-agent
[root@server1 ~]# systemctl enable zabbix-agent
[root@server1 ~]# systemctl start httpd
[root@server1 ~]# systemctl enable httpd
Unzip installation package
[root@server1 ~]# rpm -ivh zabbix-get-3.4.6-1.el7.x86_64.rpm Viewing nginx status data on server side through 10050 port of agent side
[root@server1 ~]# zabbix_get -s 172.25.10.2 -p 10050 -k 'nginx.active'
1
[root@server1 ~]# zabbix_get -s 172.25.10.2 -p 10050 -k 'nginx.requests'
63
[root@server1 ~]# zabbix_get -s 172.25.10.2 -p 10050 -k 'nginx.handled'
62
[root@server1 ~]# zabbix_get -s 172.25.10.2 -p 10050 -k 'nginx.accepts'
63
4. Configuring nginx monitoring on Zabbix Web side
Browser access 172.25.10.1/zabbix
Select monitoring items 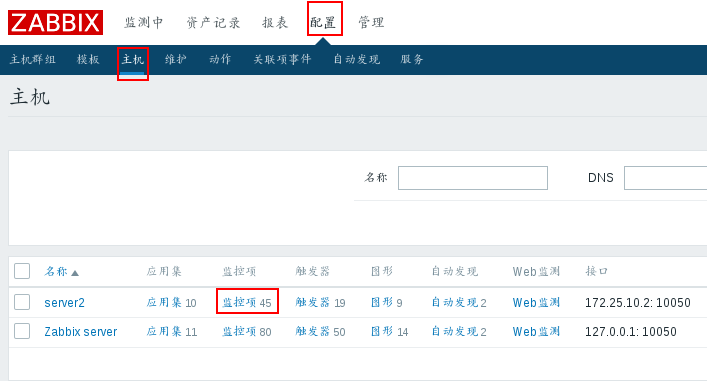
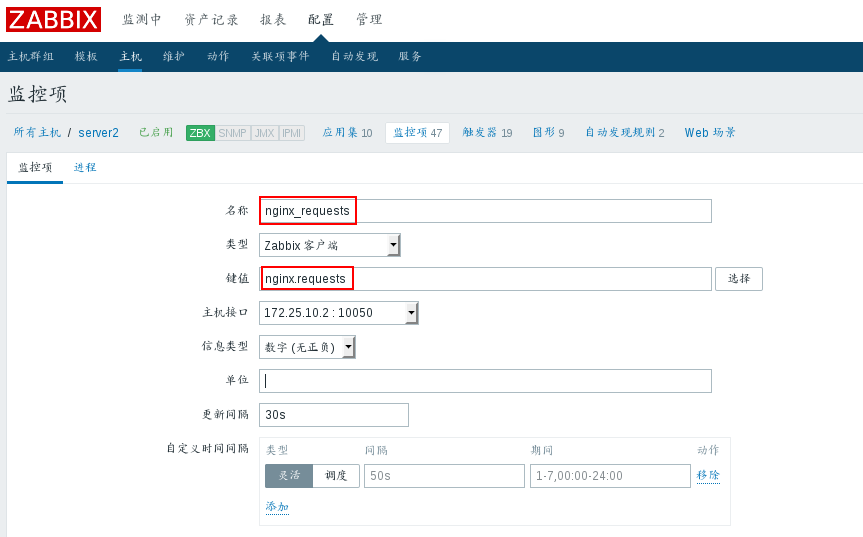
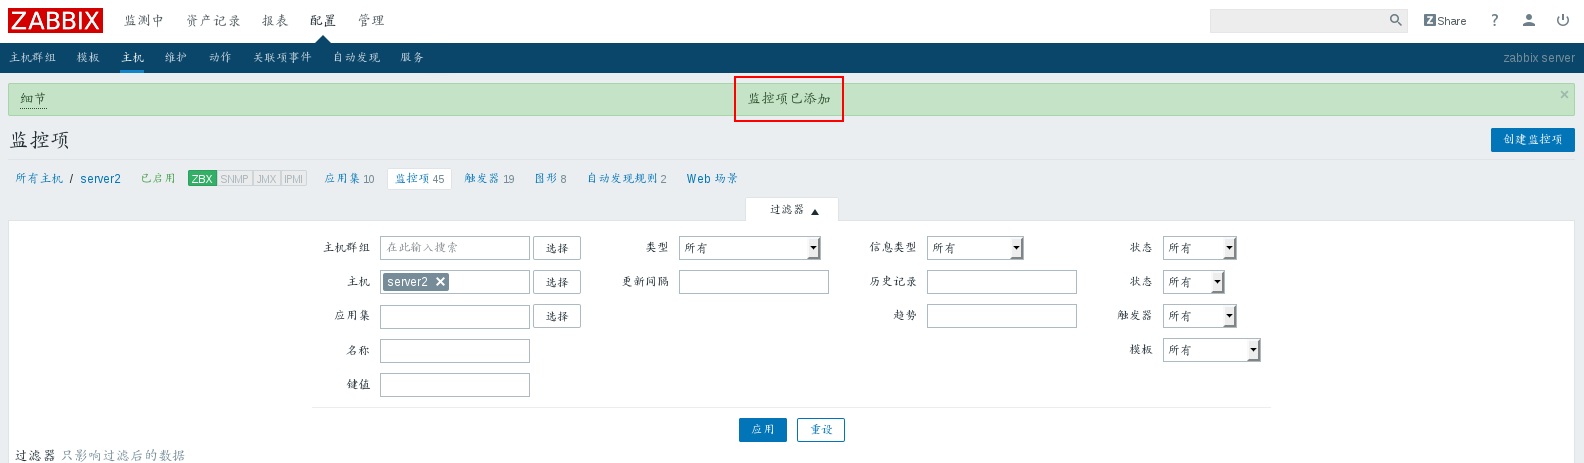
Create monitoring items 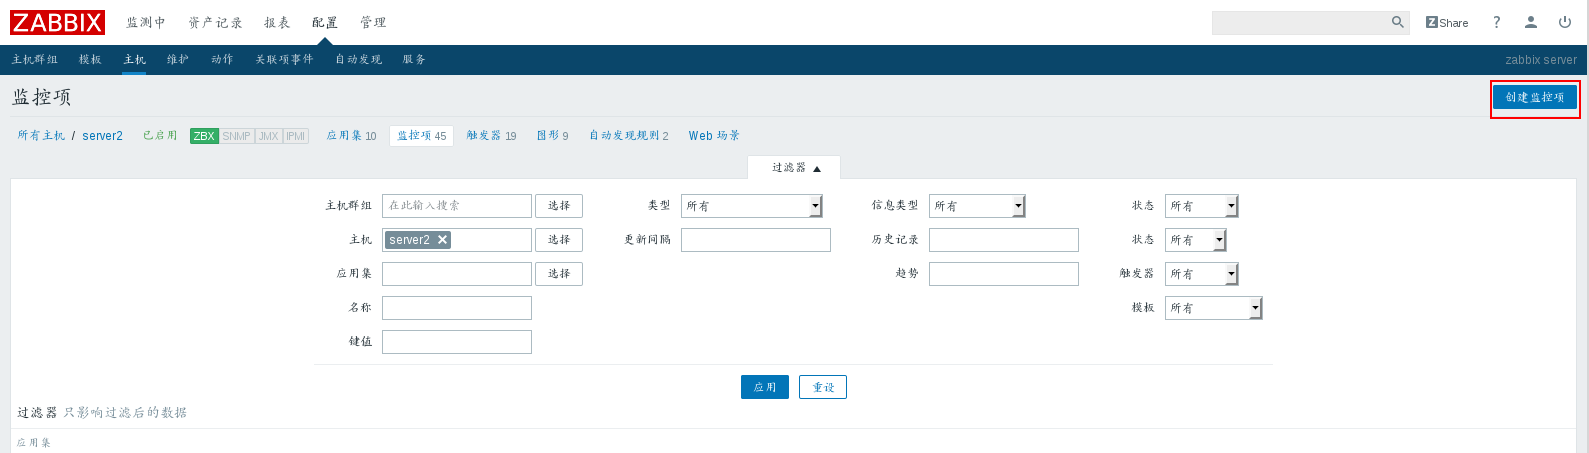
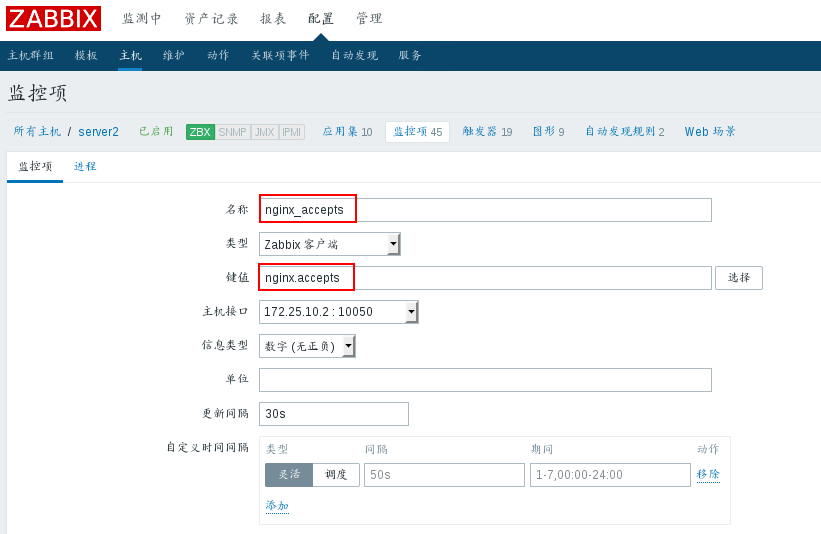
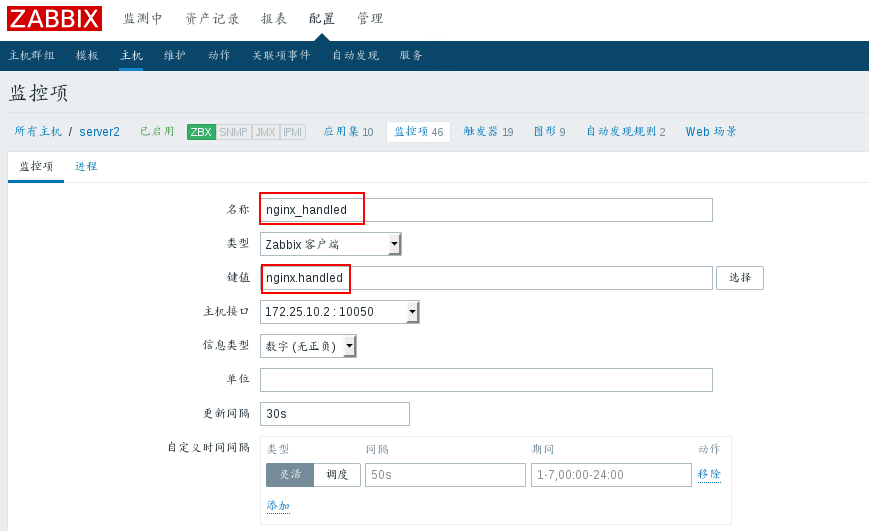
Add 4 monitoring items, fill in the name and key value in turn 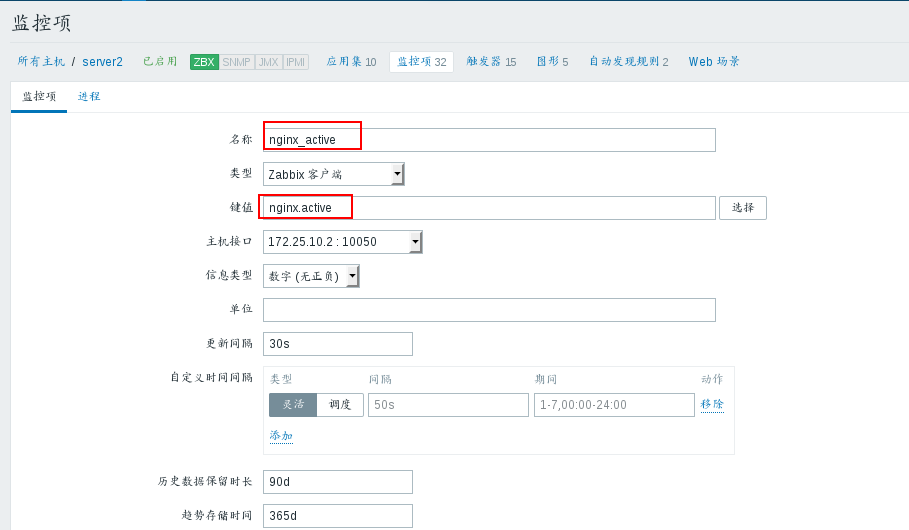
Click graph 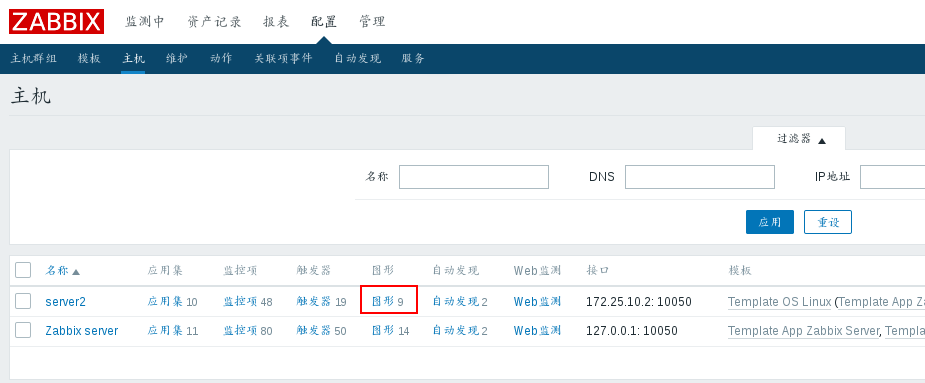
Create graphics 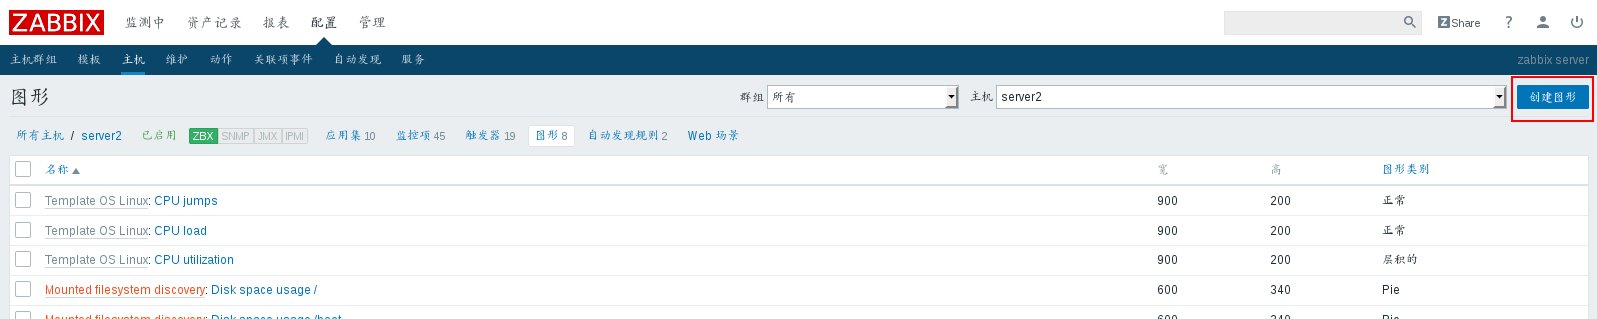
Make a name and add four monitoring items 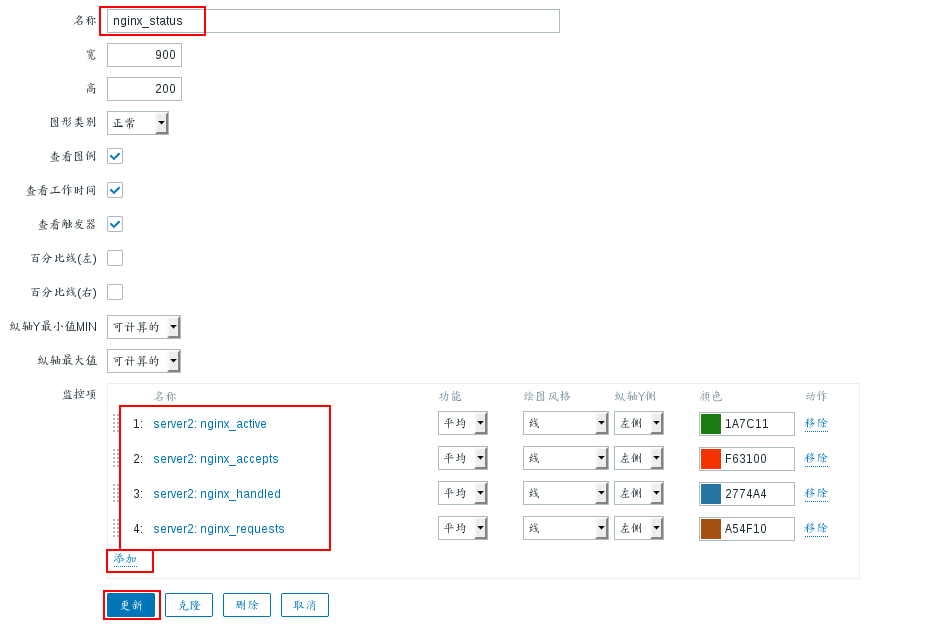
Click on the newly created graphics 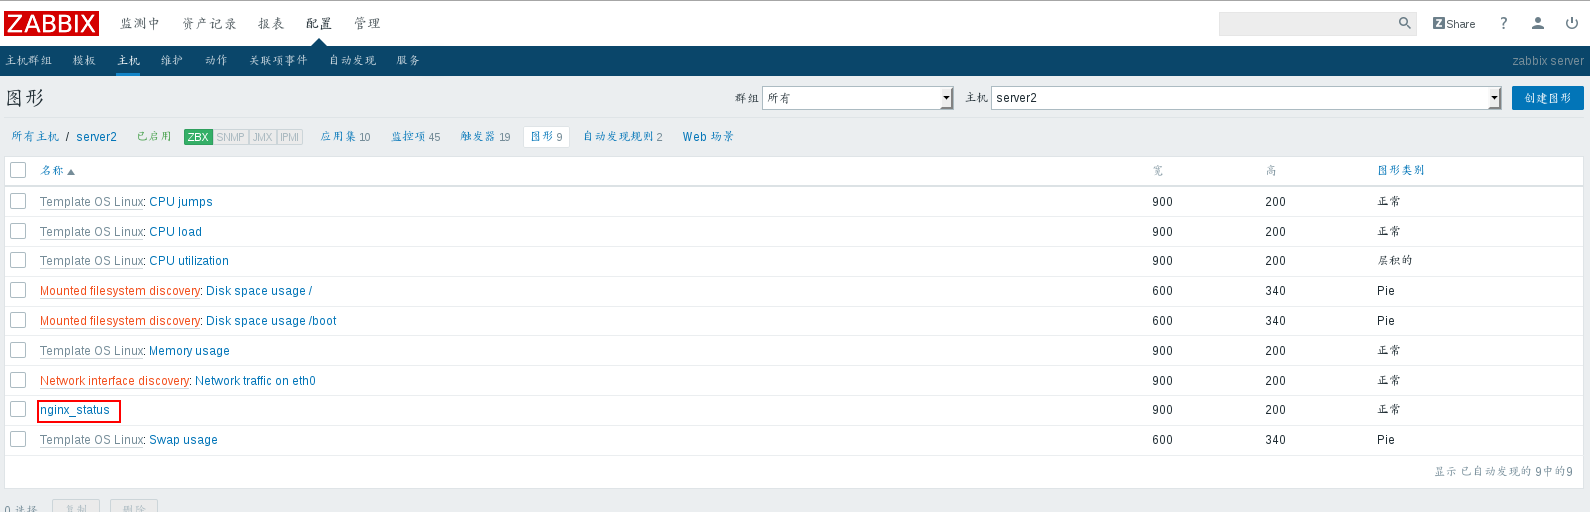
View Preview 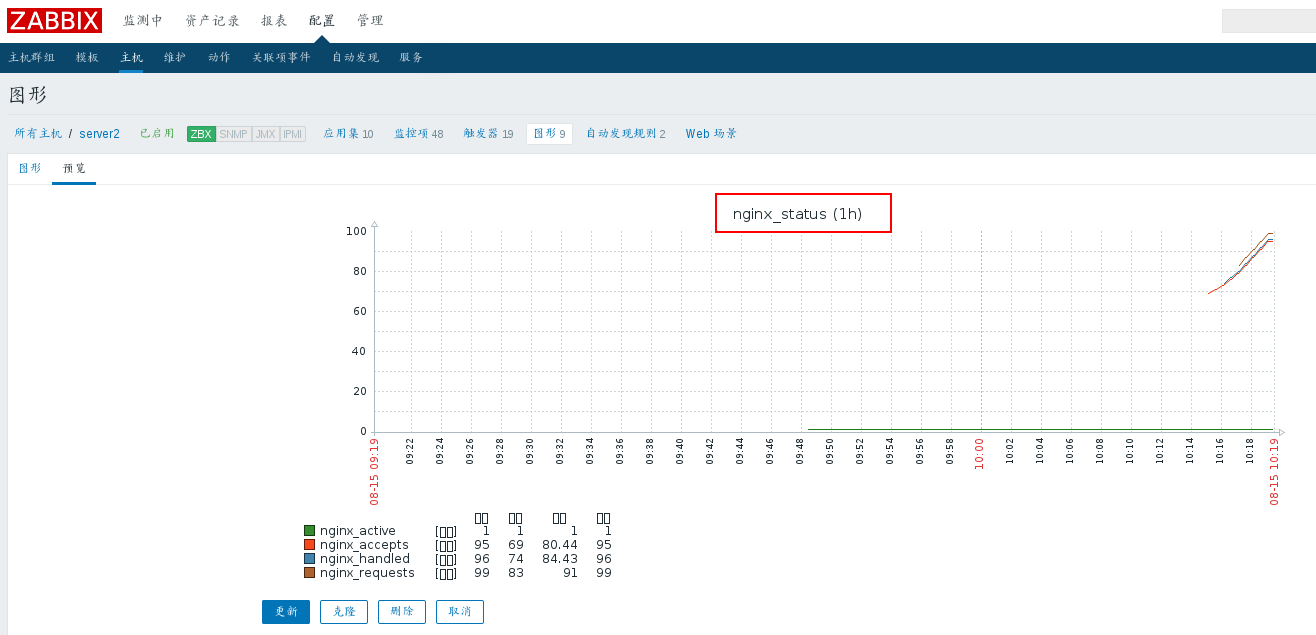
View server 2 status 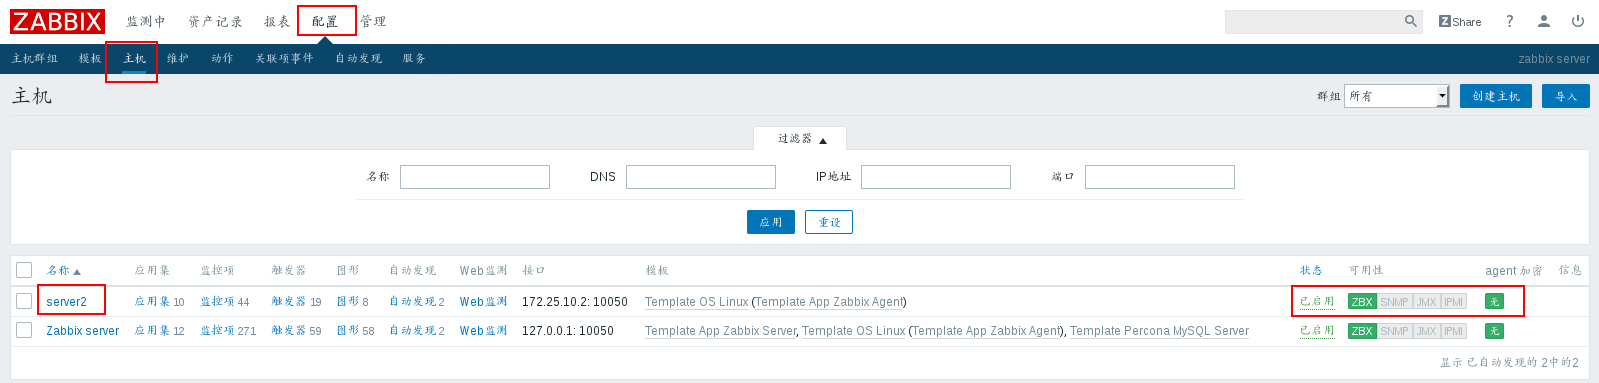
2. Zabbix monitors Mysql through percona
Introduction to Percona
Percona has improved MySQL database server, which has a significant improvement in function and performance compared with MySQL. This version improves InnoDB's performance under high load, provides some very useful performance diagnostic tools for DBA, and has more parameters and commands to control server behavior.
server1:
1. Install percona-zabbix-templates
rpm -ivh percona-zabbix-templates-1.1.8-1.noarch.rpm
 When percona is installed, two directories will be generated at / var/lib/zabbix/percona, of which:
/var/lib/zabbix/percona/scripts is the directory of monitoring scripts
 /var/lib/zabbix/percona/templates is the xml template directory for monitoring mysql
2. Configuring Zabbix Agent
Place the.conf file in the template directory under / etc/zabbix/zabbix_agent d.d/.
[root@server1 zabbix]# cd /var/lib/zabbix/percona/templates/
[root@server1 templates]# cp userparameter_percona_mysql.conf /etc/zabbix/zabbix_agentd.d/
Restart service
systemctl restart zabbix-agent
3. Configuring Mysql Connections on Agent s
View script directory
[root@server1 templates]# cd /var/lib/zabbix/percona/scripts/
[root@server1 scripts]# ls
get_mysql_stats_wrapper.sh  ##The script for sh monitors the status of MySQL
ss_get_mysql_stats.php      ##The php file is configured to connect to the database username password
//Create. cnf file designationMysqlUser name and password
[root@server1 scripts]# vim /var/lib/zabbix/percona/scripts/ss_get_mysql_stats.php.cnf
<?php
$mysql_user = 'root';
$mysql_pass = 'westos';
//Login mysql to create the account (login validation) for monitoring, no need to do anything, exit
[root@server1 scripts]# mysql -p
//Test script
[root@server1 scripts]# /var/lib/zabbix/percona/scripts/get_mysql_stats_wrapper.sh gg
4
4. Delete txt file
[root@server1 scripts]# cd /tmp/
[root@server1 tmp]# ls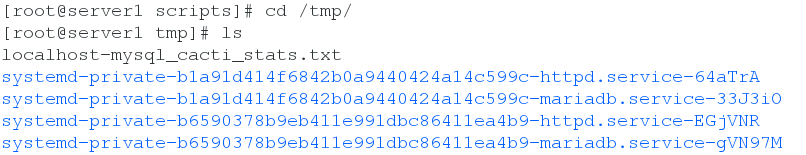
[root@server1 tmp]# rm -fr localhost-mysql_cacti_stats.txt 5. Configure the basic parameters for accessing Mysql
[root@server1 ~]# vim ~zabbix/.my.cnf
[client]
user = root
password = westos
Restart the zabbix agent service
[root@server1 ~]# systemctl restart zabbix-agentTest (127.0.0.1 is the ip address of the monitored host)
[root@server1 ~]# zabbix_get -s 127.0.0.1 -p 10050 -k 'MySQL.Threads-cached'
6. Add perconamysql monitoring in zabbix management interface
Import template 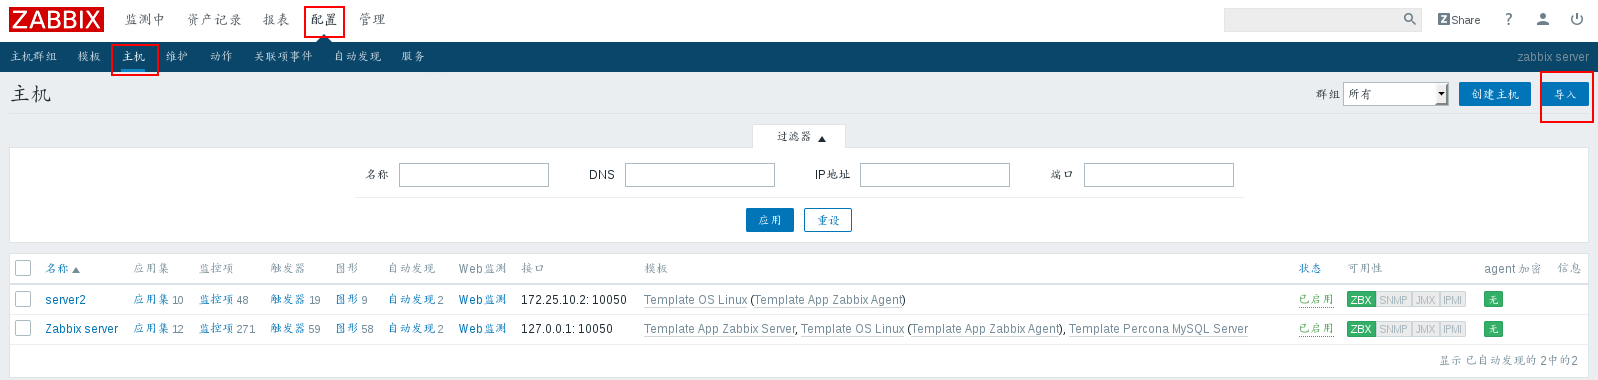
Template name, rule configuration according to picture 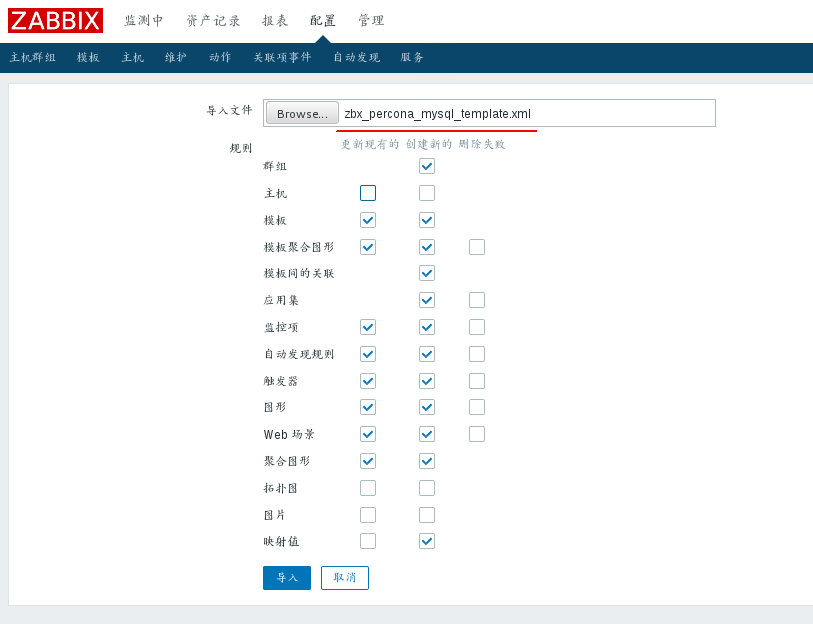
After importing, you can view it. 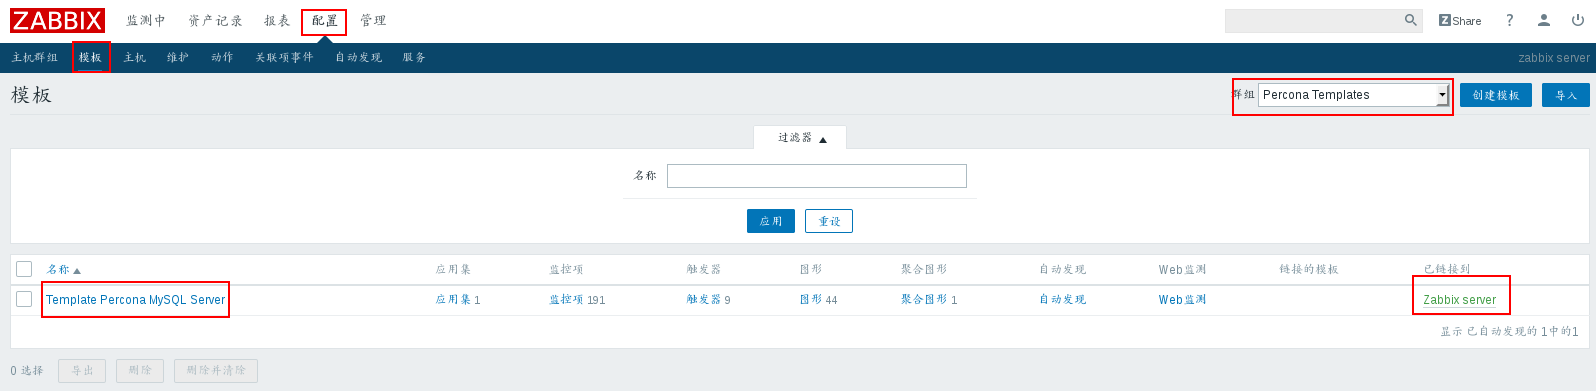
Point into the Zabbix server host 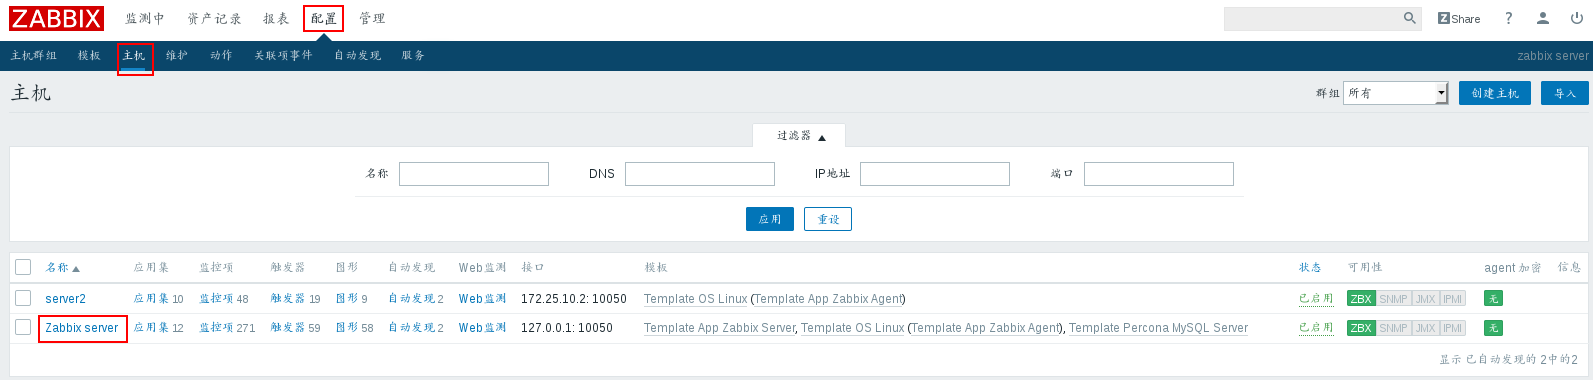
add template 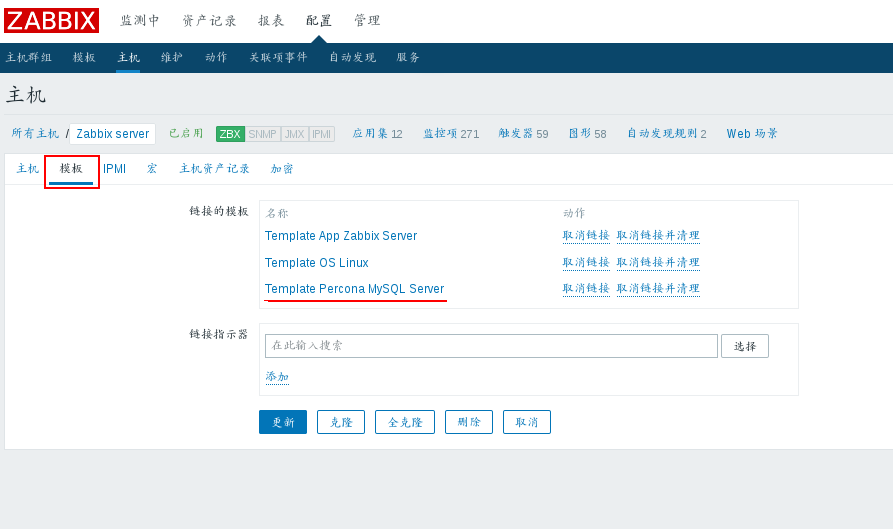
View host status after adding 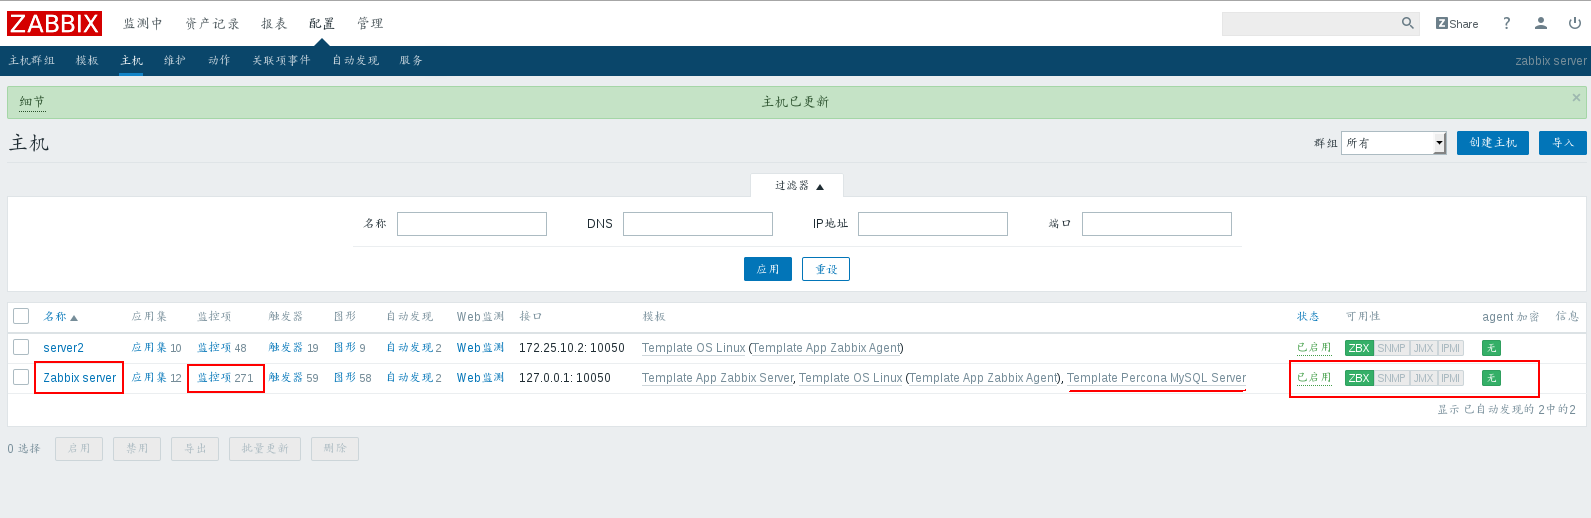
view drawings 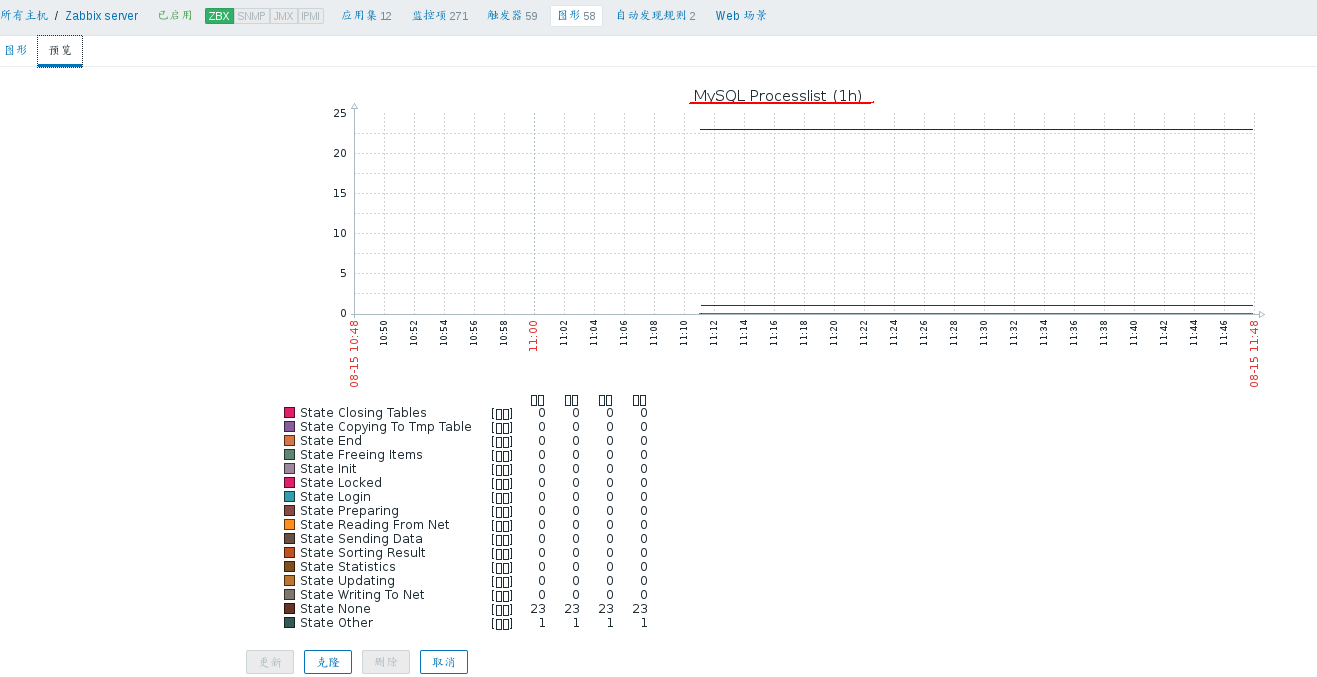
3. Monitoring tomcat by Zabbix
How it works: When Zabbix-Server needs to know something about the performance of a Java application, it launches its own Zabbix-JavaPollers process to connect Zabbix-JavaGateway requests for data, while the Zabbix Java gateway uses the "JMX management API" to query a specific application when it receives a request, provided that the application needs "-Dcom.sun.management.jmxxway" at the start of the application. Mote parameter to open JMX remote query is fine. The Java program starts its own simple widget port 12345 to provide the requested data to Zabbix-Java Gateway.
Monitoring type: java 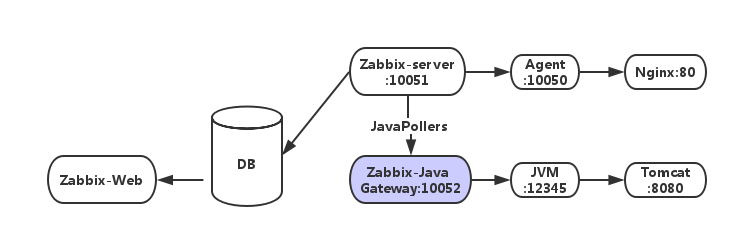
1. Configuring the zabbix-agent client Tomcat JMX, the remote call script of tomcat
server2:
Install jdk, tomcat
[root@server2 ~]# rpm -ivh jdk-8u121-linux-x64.rpm
[root@server2 ~]# tar zxf apache-tomcat-7.0.90.tar.gz -C /usr/local/
Making Soft Links
[root@server2 ~]# cd /usr/local/
[root@server2 local]# ln -s apache-tomcat-7.0.90/ tomcat
Start tomcat
[root@server2 local]# cd tomcat/
[root@server2 tomcat]# bin/startup.sh
Using CATALINA_BASE:   /usr/local/tomcat
Using CATALINA_HOME:   /usr/local/tomcat
Using CATALINA_TMPDIR: /usr/local/tomcat/temp
Using JRE_HOME:        /usr
Using CLASSPATH:       /usr/local/tomcat/bin/bootstrap.jar:/usr/local/tomcat/bin/tomcat-juli.jar
Tomcat started.
View process
ps ax
 5357 pts/0    Sl     0:02 /usr/bin/java -Djava.util.logging.config.file=/usr/loca
View port
netstat -anltp
tcp        0      0 :::8080                     :::*                        LISTEN      5357/java
Configure jmx to edit catalina.sh and add the following configuration lines 108 to 111
[root@server2 tomcat]# cd bin/
[root@server2 bin]# vim catalina.sh
106 # ----------------------------------------------------------------------------    -
107
108 CATALINA_OPTS='-Dcom.sun.management.jmxremote  #Open remote monitoring
109   -Dcom.sun.management.jmxremote.port=8888 #Remote monitoring port
110   -Dcom.sun.management.jmxremote.ssl=false #Remote ssl validation is false
111   -Dcom.sun.management.jmxremote.authenticate=false' #Turn off Authentication
112
113 # OS specific support.  $var _must_ be set to either true or false.
Restart tomcat
[root@server2 bin]# ./shutdown.sh
[root@server2 bin]# ./startup.sh
Verify that jmx listening was started successfully: View port changed to 8888
[root@server2 bin]# netstat -antlp
tcp        0      0 :::8888                     :::*                        LISTEN      5785/java
2. Zabbix server configuration
First, we need to understand their correspondence. zabbix_server opens java poller, zabbx_java opens JavaGateway, port 10052, Tomcat JMX opens port 8888 to provide performance data.
Data acquisition: Java poller < -> JavaGateway: 10052 < -> Tomcat: 8888
server1:
Install zabbix-java-gateway
[root@server1 ~]# yum install -y zabbix-java-gateway-3.4.6-1.el7.x86_64.rpm
[root@server1 ~]# cd /etc/zabbix/
[root@server1 zabbix]# vim zabbix_java_gateway.conf  ##Just look at it.
Opening service
[root@server1 zabbix]# systemctl start zabbix-java-gatewayView port 10052
[root@server1 zabbix]# netstat -antlp |grep 10052
tcp6       0      0 :::10052                :::*                    LISTEN      18107/java
Once Zabbix Java GateWay is started, it also needs to be configured on Zabbix Server
Configure Zabbix server access gateway
[root@server1 zabbix]# vim zabbix_server.conf
262 JavaGateway=172.25.10.1  #gateway address
270 JavaGatewayPort=10052    #Monitor port
278 StartJavaPollers=5       #Number of pre-startup process rounds
Restart the Zabbix server service
[root@server1 zabbix]# systemctl restart zabbix-server3. Adding hosts and templates to Zabbix to start monitoring Java
Select server 2 host 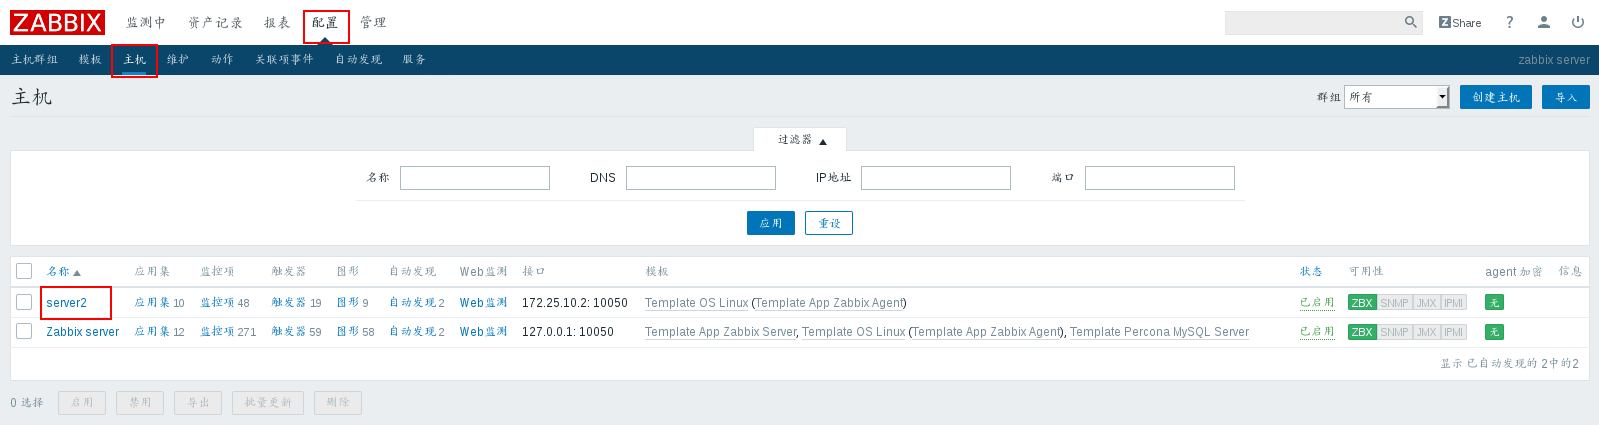
Add JMX interface IP and port 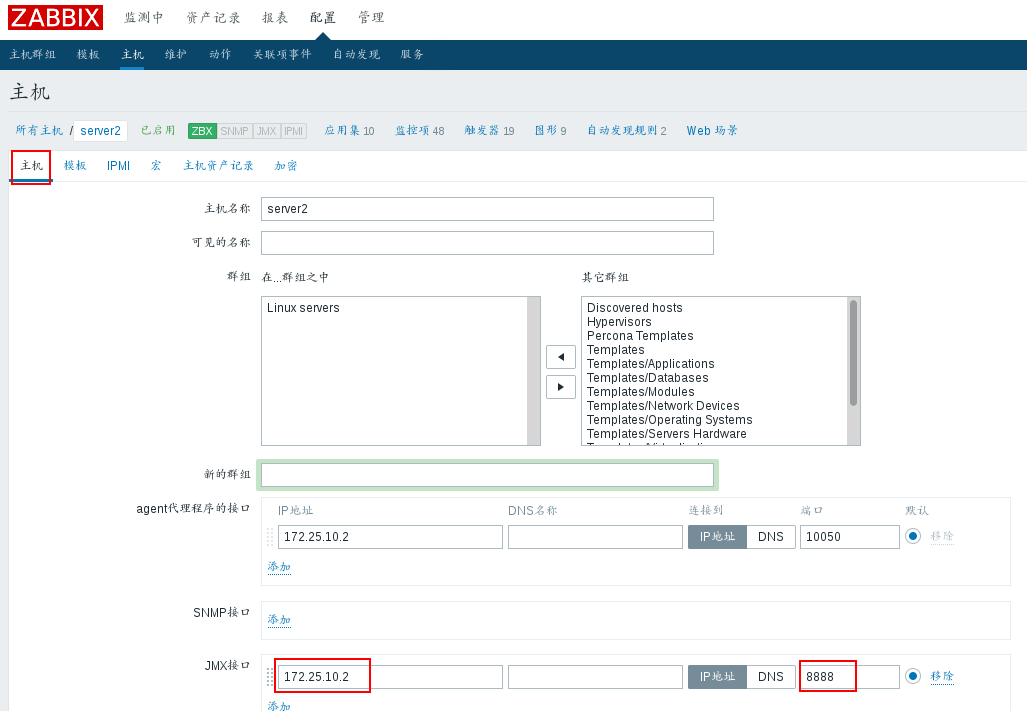
add template 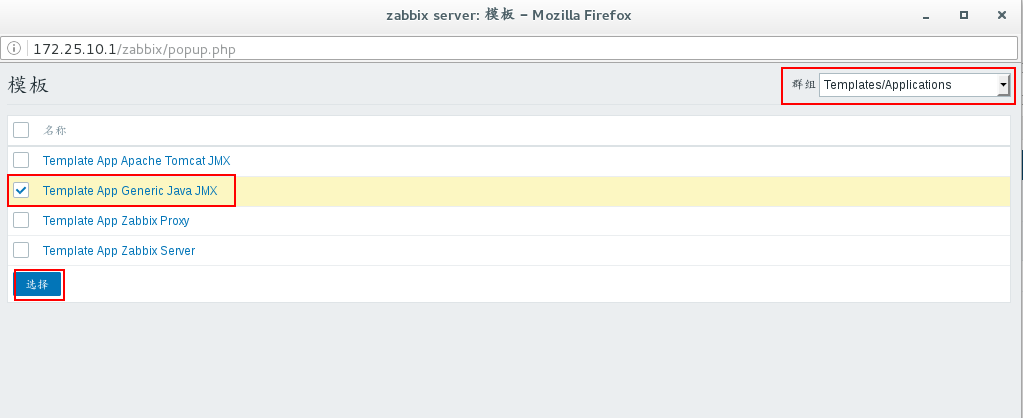
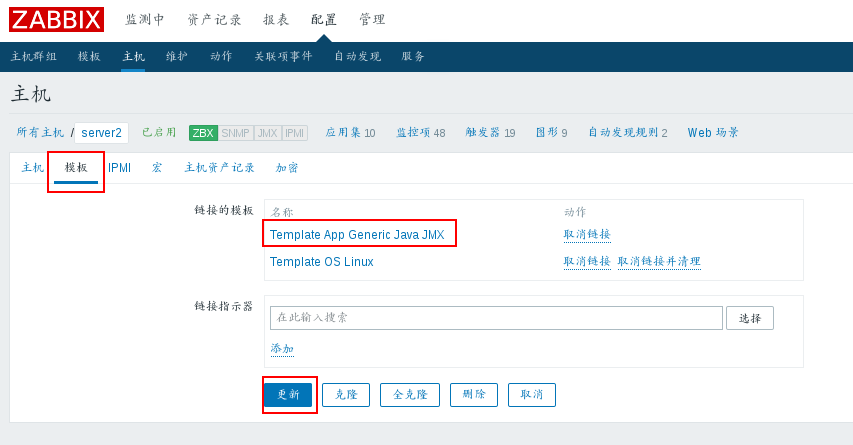
Host JMX Availability Turn on 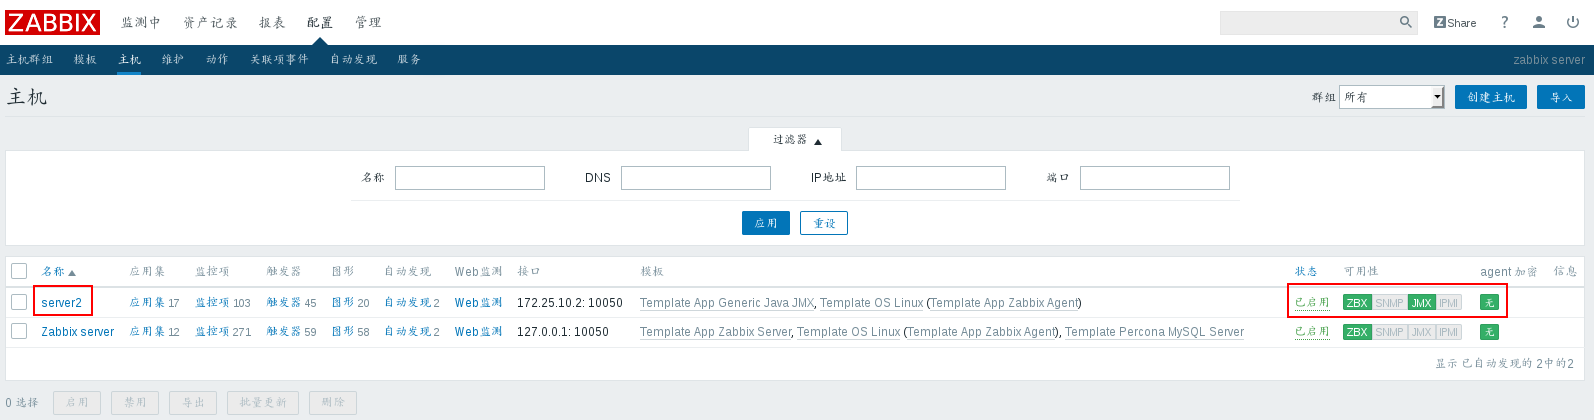
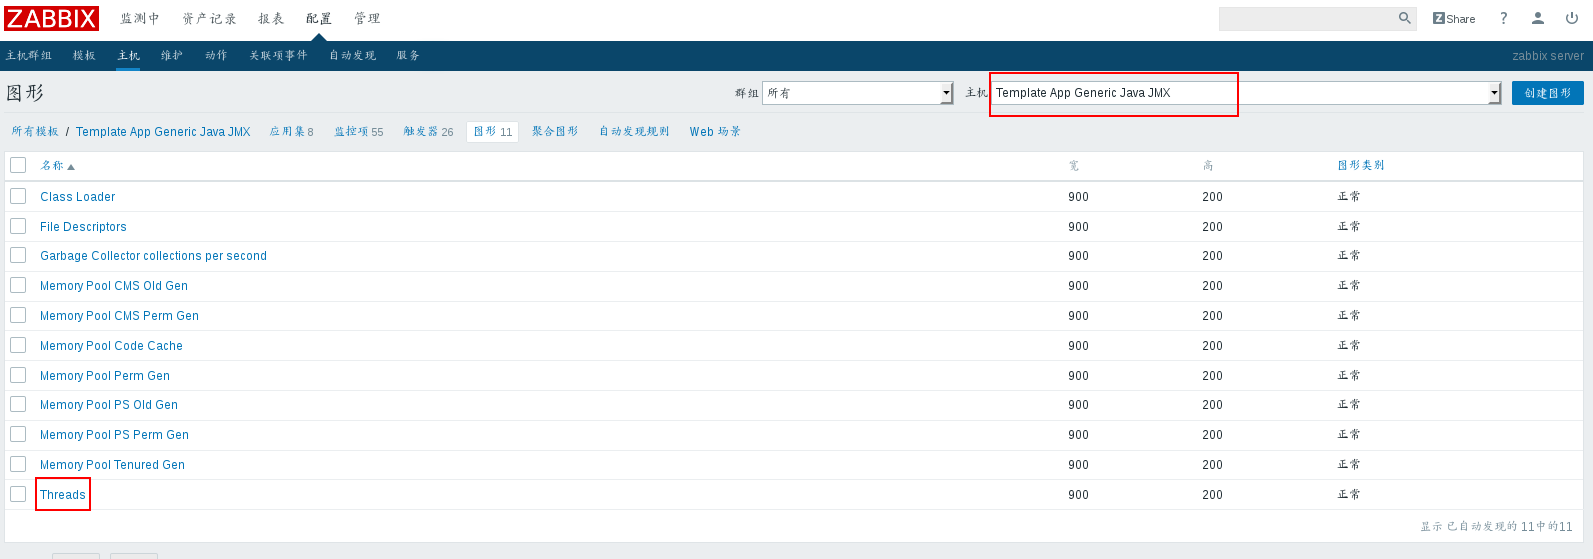
view drawings 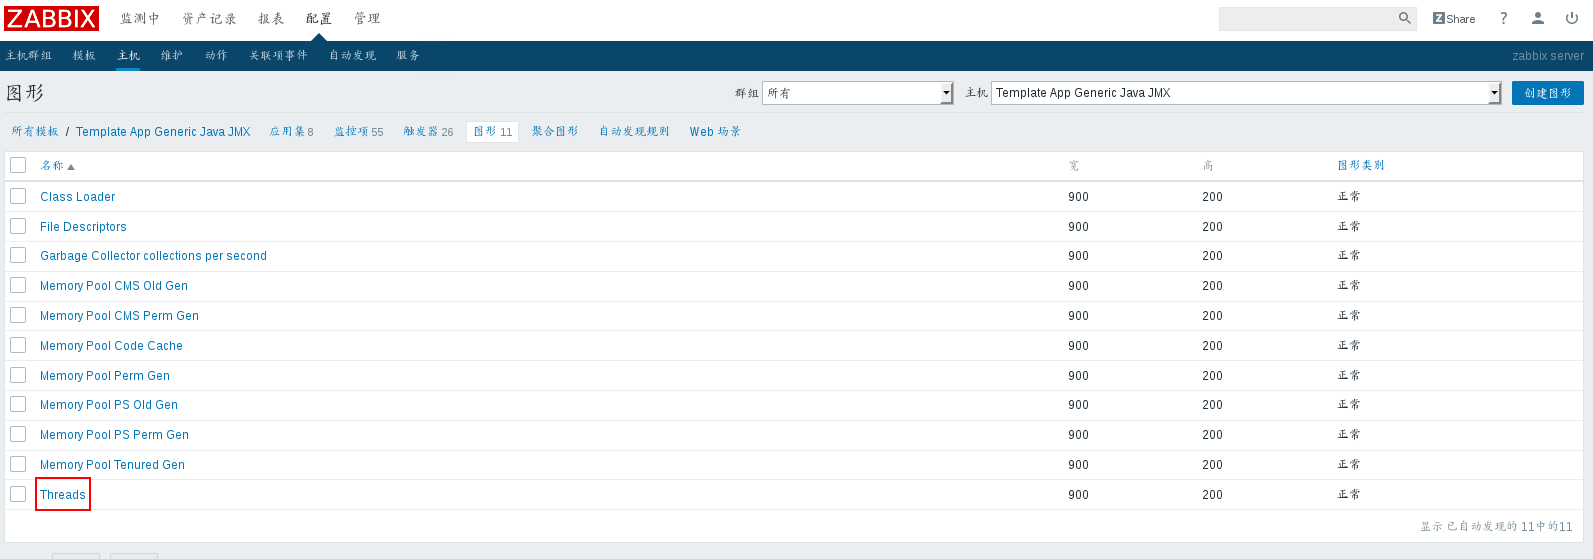
IV. OneAlert Monitoring Zabbix Warning
Let the Virtual Machine surf the Internet first
Real machine:
Modifying Firewall Policy
iptables -t nat -I POSTROUTING -s 172.25.10.0/24 -j MASQUERADEVirtual machine:
server1:
Temporary Addition Gateway
route add default gw 172.25.10.250View gateway
route -nEdit file
vim /etc/resolv.conf
nameserver 114.114.114.114
See if you can surf the Internet
ping www.baidu.comserver1:
1. Mobile OneITSM agent package to zabbix script directory
[root@server1 ~]# mv oneitsm_zabbix_release-1.2.0.tar.gz /usr/lib/zabbix/alertscripts
 Plus: View the zabbix script directory method:
vim /etc/zabbix/zabbix_server.conf
 View AlertScriptsPath
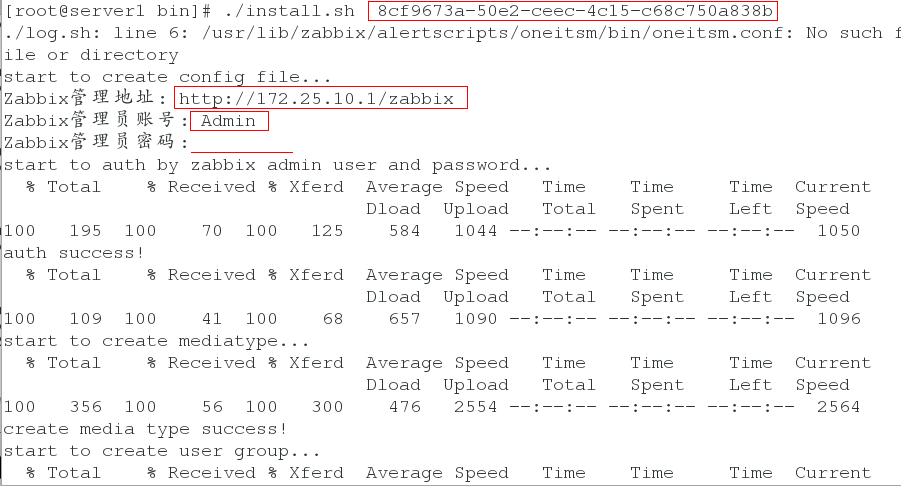
2. Decompression and Installation
[root@server1 ~]# cd /usr/lib/zabbix/alertscripts/
[root@server1 alertscripts]# tar zxf oneitsm_zabbix_release-1.2.0.tar.gz
[root@server1 alertscripts]# cd oneitsm/bin/
[root@server1 bin]. / install.sh 8cf9673a-50e2-ceec-4c15-c68c750a838b # is the appkey generated for the new application after uuuuuuuuuuuu
 Note: During installation, according to installation prompt, enter zabbix management/monitoring/web landing address, administrator username and password.
Zabbix Address: http://172.25.10.1/zabbix
 Zabbix Administrator Account: Admin
 Zabbix Administrator Password:
When prompted "Successful installation", it means successful installation!
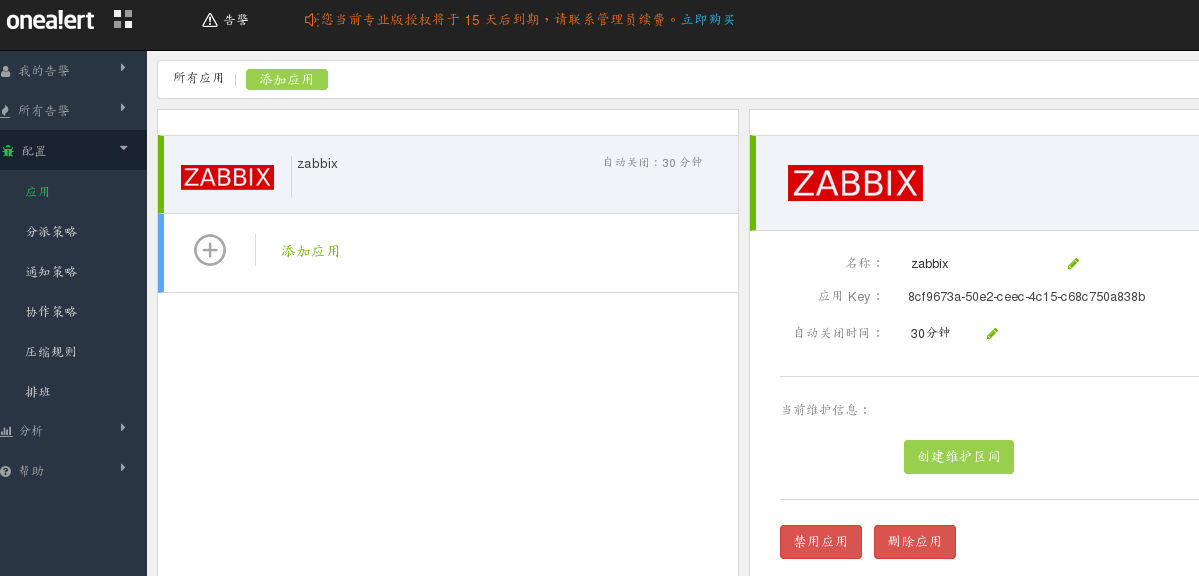
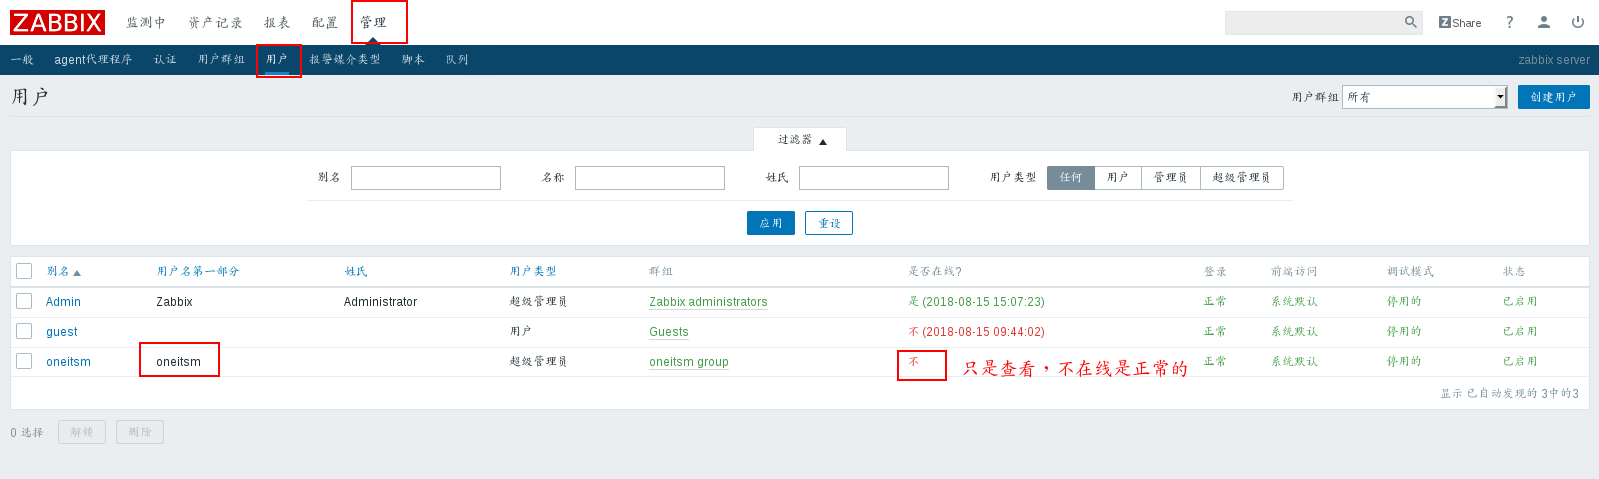
3. Zabbix Web-side
View the connection status of Zabbix and OneAlert 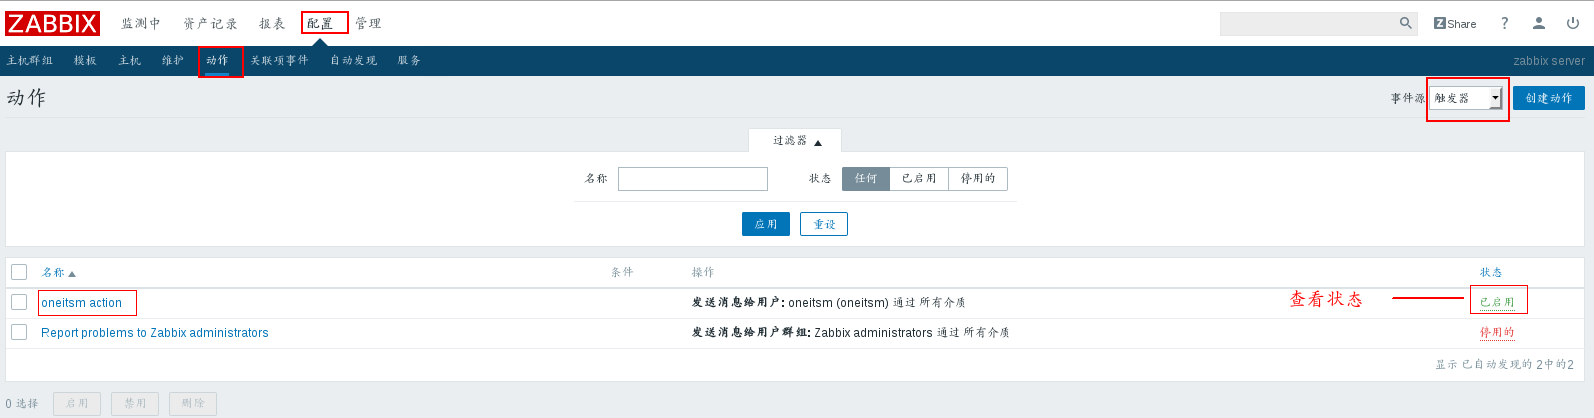
Disable alarm media types 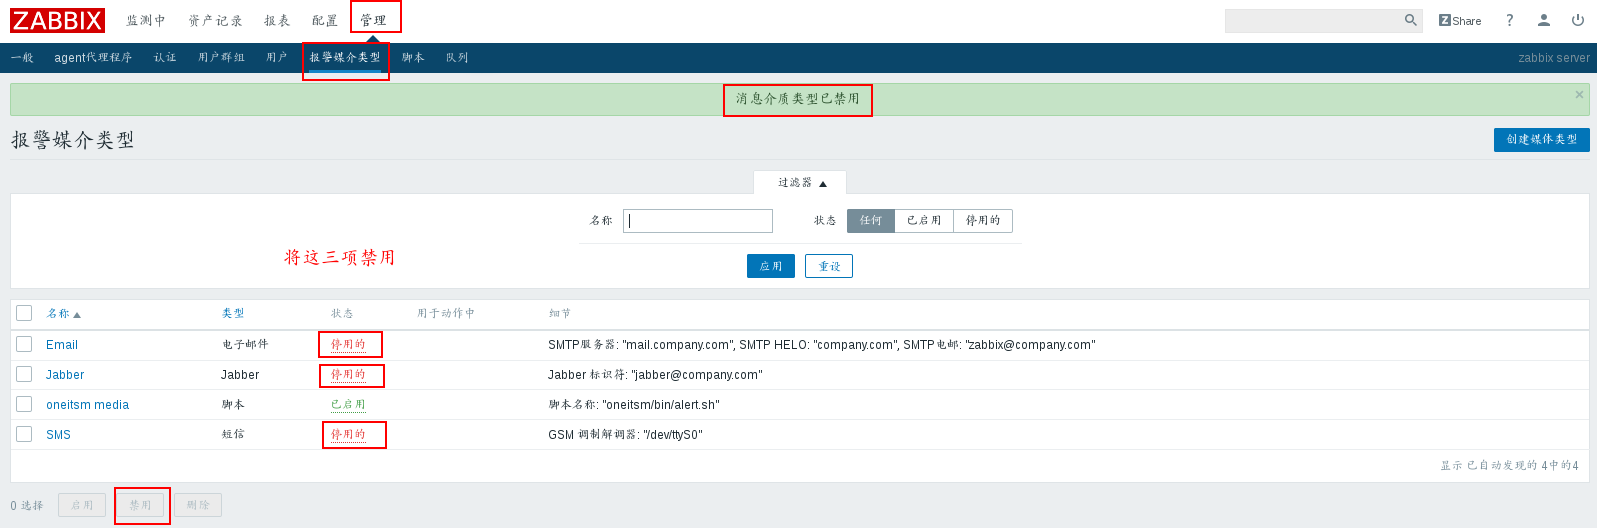
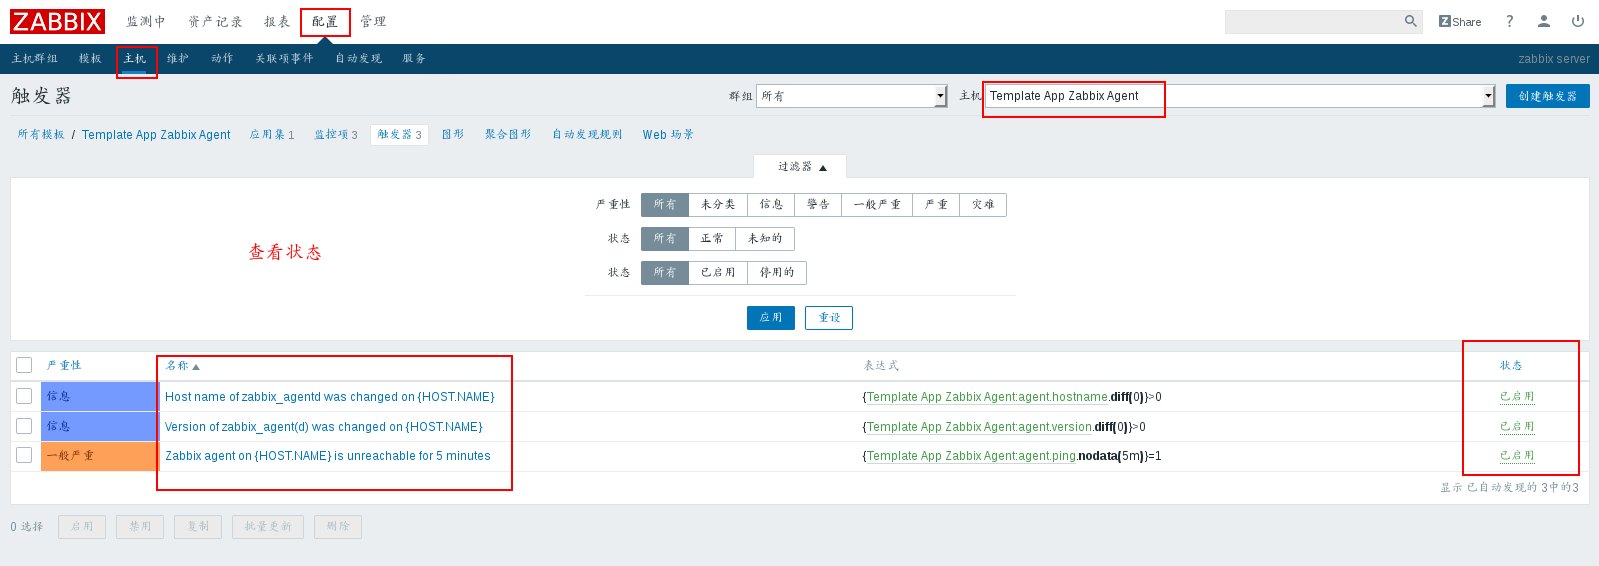
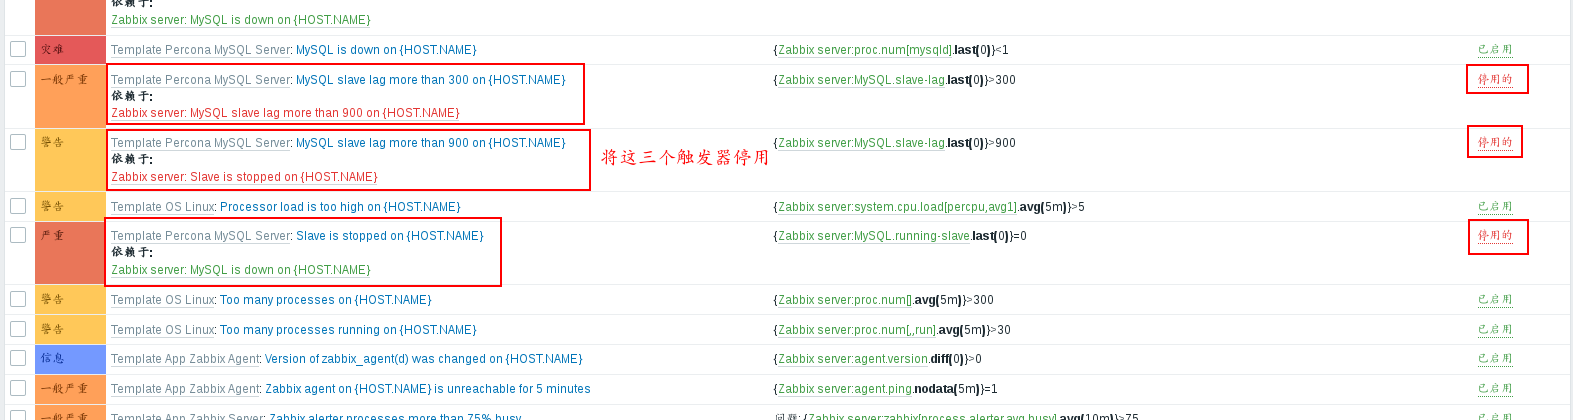
Disable triggers 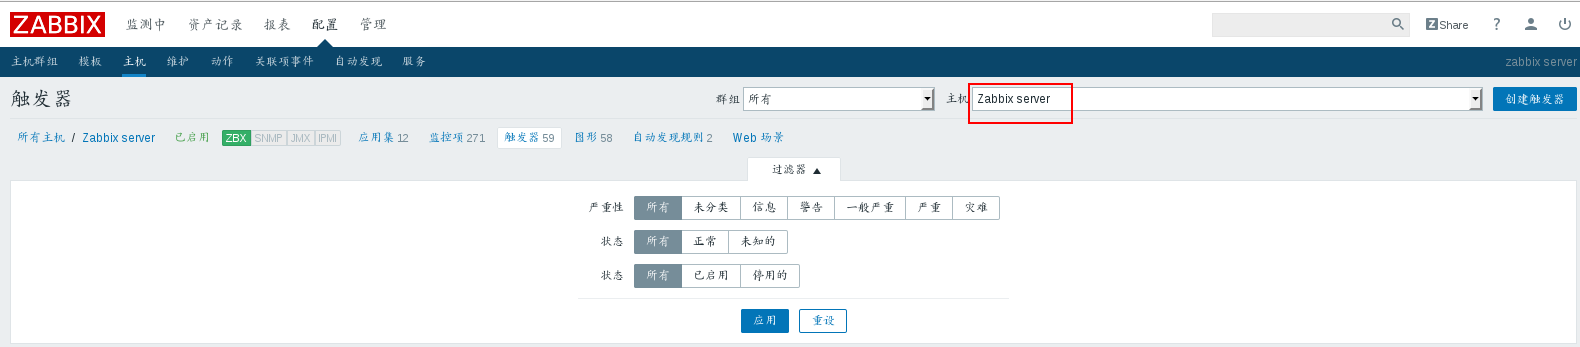
Test Warning:
server2:
/etc/init.d/zabbix-agent stop
Questions can be seen on the Web side 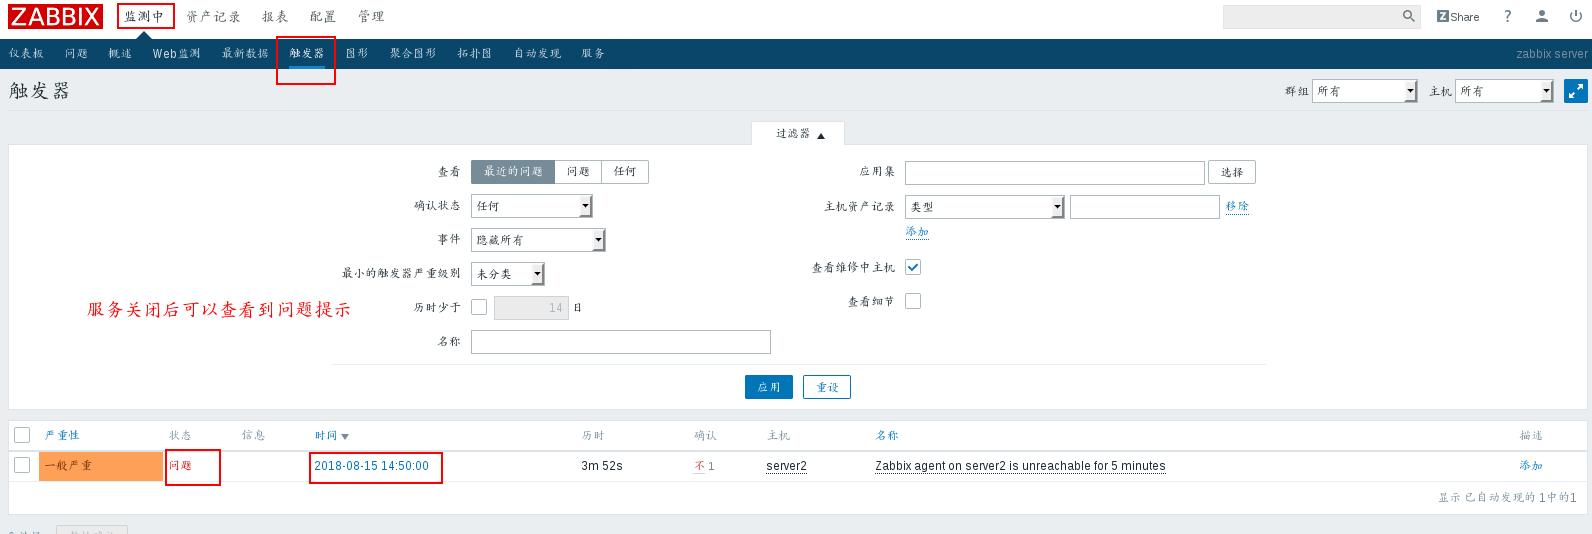
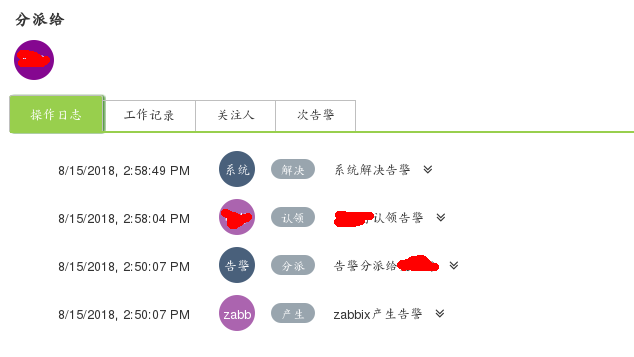
After the alarm is claimed on the monitoring page, the relevant content can be viewed in "Processing" 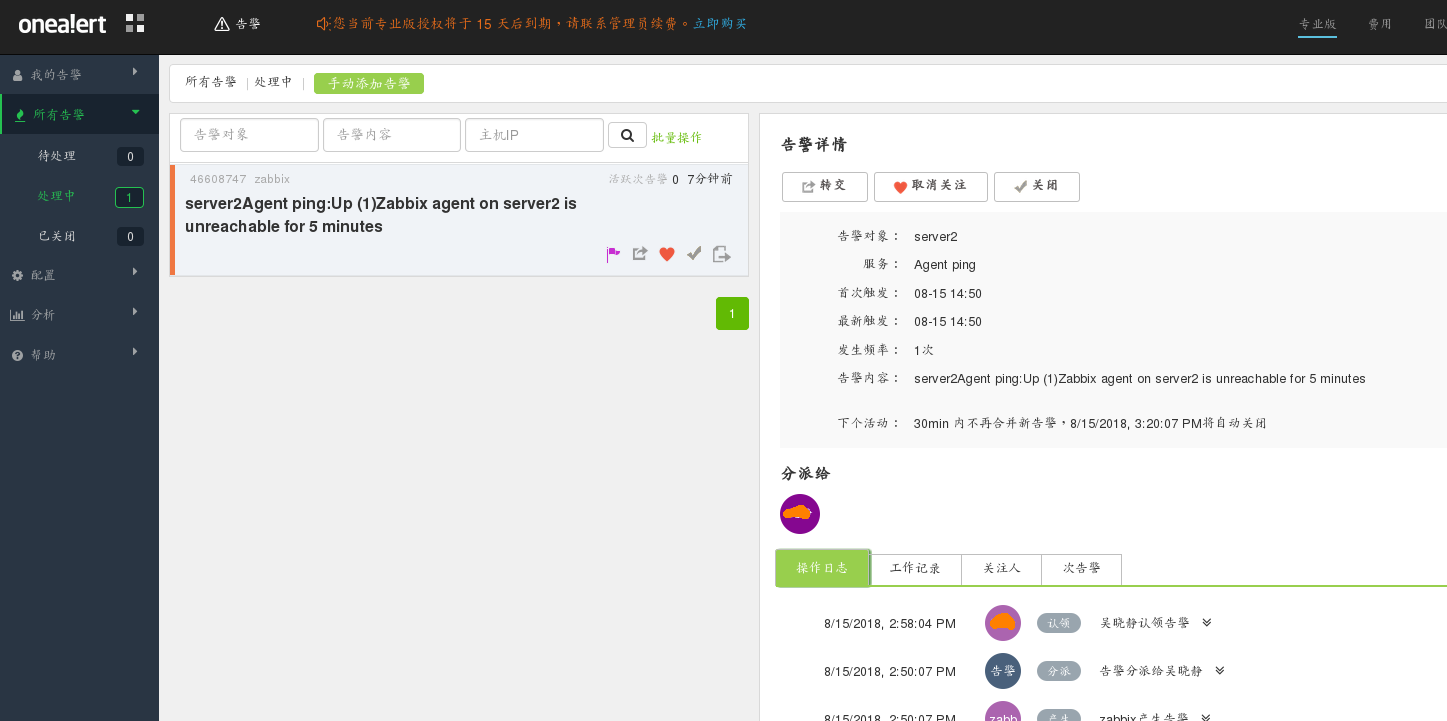
Recovery service/etc/init.d/zabbix-agent start
You can see problem solving on the Web side 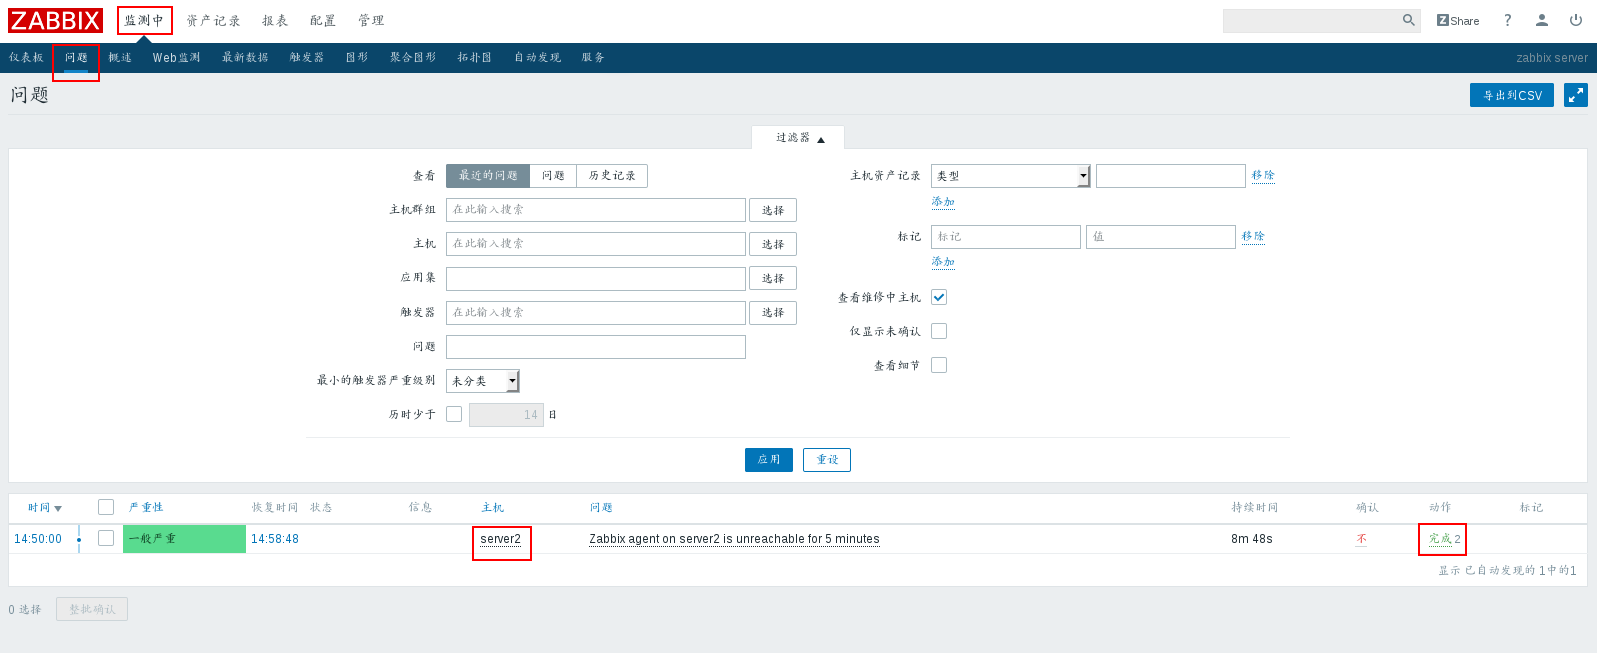
Monitoring pages are also displayed