Prometheus and Grafana monitor Mysql server performance
Mysql monitoring is a topic that I believe DBA and operation and maintenance are very familiar with. The monitoring methods are also divided into interactive and non-interactive. There are many tools, such as Zabbix, Lepus, Nagios. PMM (need docker to run) and so on, all kinds of tools have their own characteristics here, not much analysis, specific can be understood by ourselves, here we use a monitoring system similar to PMM: Prometheus+Grafana
Specific installation process and configuration can be referred to: Monitoring Mysql server performance using Prometheus and Grafana as well as prometheus
prometheus: prometheus
grafana-dashboards:grafana-dashboards
mysqld_exporter:mysqld_exporter
node_exporter]:node_exporter
All content download address: https://prometheus.io/ perhaps Baidu cloud disk Password: nh70
Here is a description of the problems I encountered in the installation process and the description of the configuration file.
1,Error pinging mysqld: Error 1045: Access denied for user 'prom'@'::1' (using password: YES) source="mysqld_exporter.go:268"
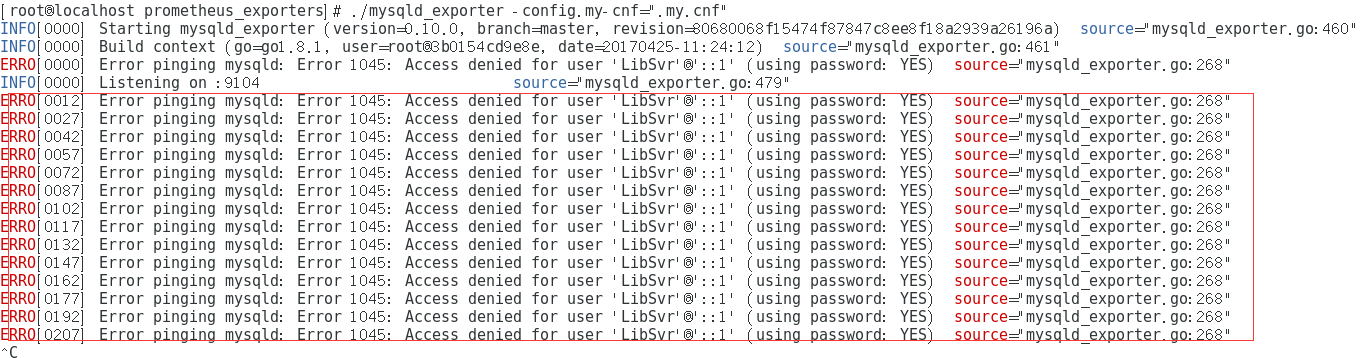
It's obvious that the database connection failed. Look at the configuration modification of the user in the database. I created the user according to icyfire, but my monitoring and monitoring Client component and monitoring Server all have this problem on one machine. If deployed on different machines, it should not have this problem.
2,Failed to update dashboard json index lstat /var/lib/grafana/dashboards: no such file or directory
After installing Grafana according to icyfire's tutorial, Dashboard will not be displayed: 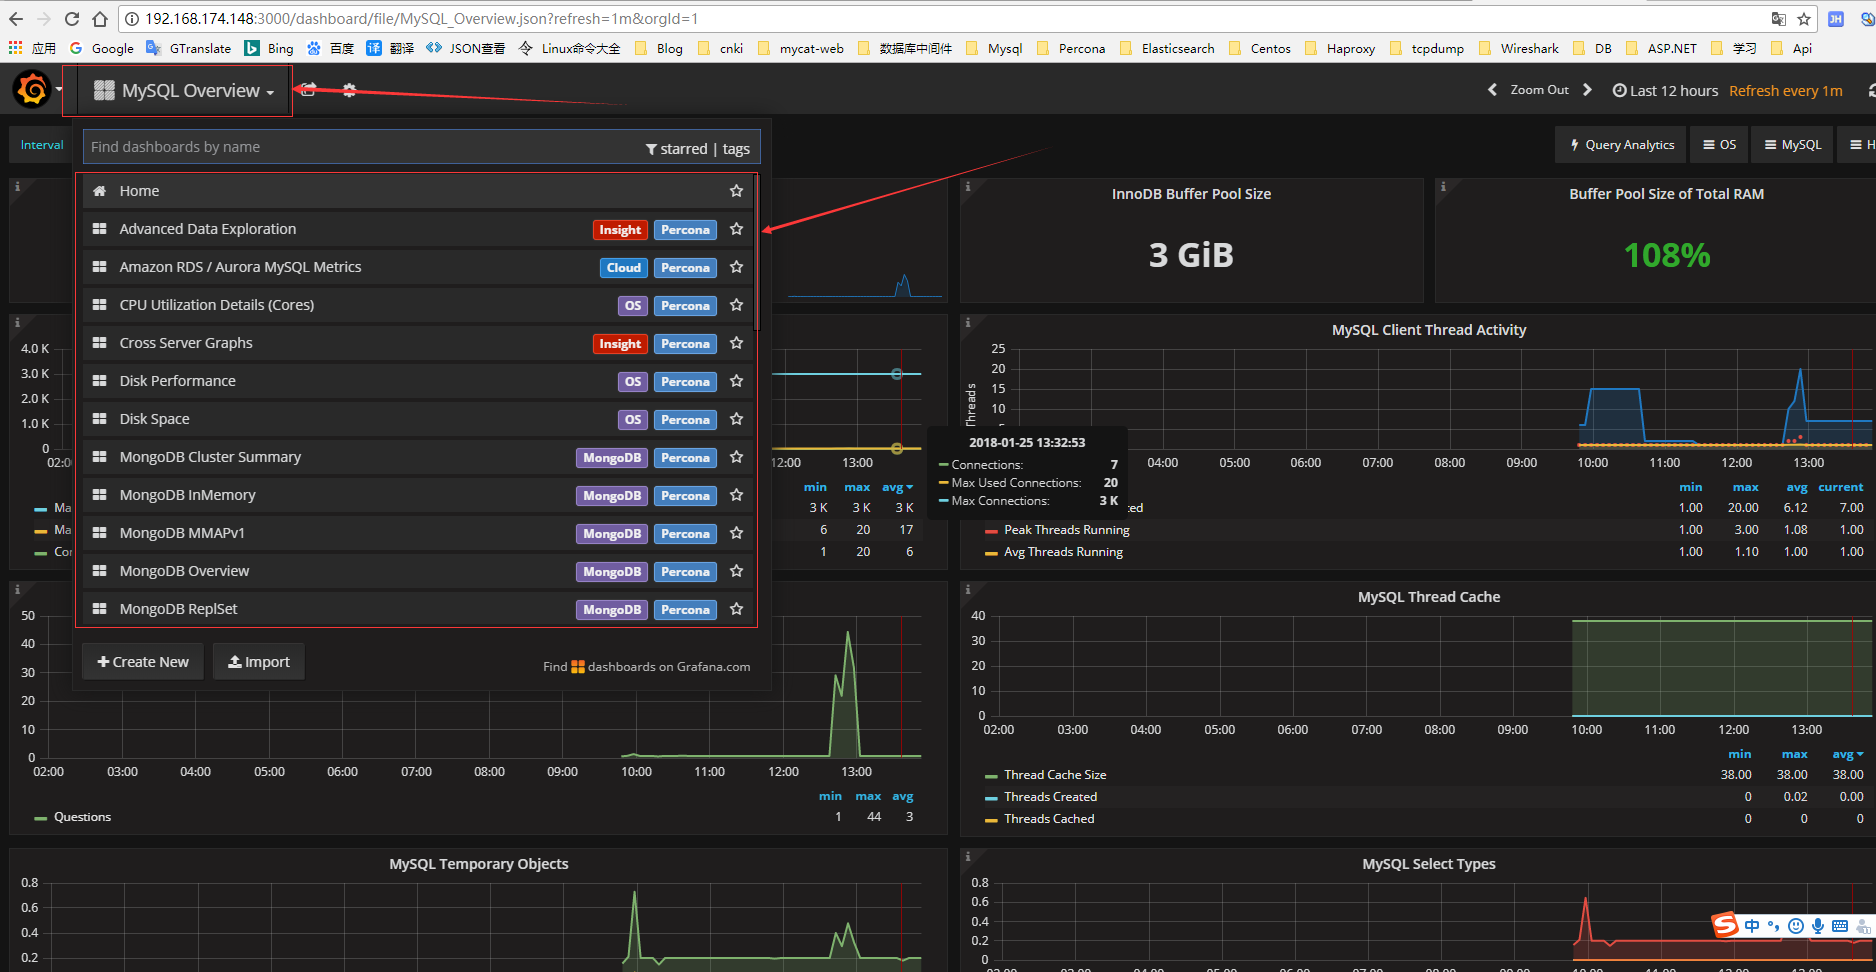
Click on Dashboard to show only the Home item (the screenshot is processed), and all the other data is not displayed. Obviously, Dashboard is not loaded, but according to 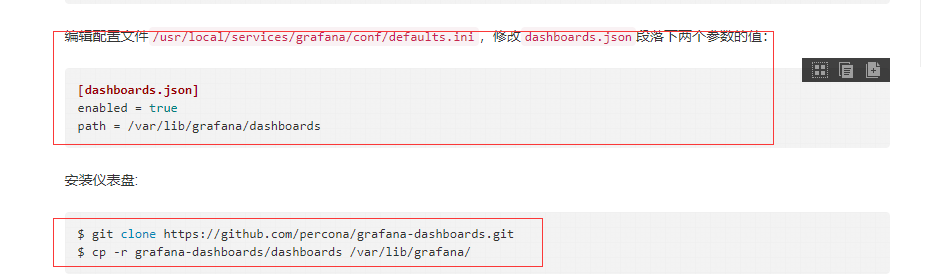
This configuration is obviously where the configuration is wrong. First of all, I want to confirm whether the configuration information is wrong.
#################################### Dashboard JSON files ################
[dashboards.json]
enabled = true
path = /var/lib/grafana/dashboards
I found it right. Open grafana-server and open the console to see if there is an error. As a result, the error is reported. The information is as follows:
[root@localhost bin]# ./grafana-server
INFO[01-25|10:54:59] Starting Grafana                         logger=main version=4.3.1 commit=befc15c compiled=2017-05-23T21:50:22+0800
INFO[01-25|10:54:59] Config loaded from                       logger=settings file=/usr/local/services/grafana/conf/defaults.ini
INFO[01-25|10:54:59] Path Home                                logger=settings path=/usr/local/services/grafana
INFO[01-25|10:54:59] Path Data                                logger=settings path=/usr/local/services/grafana/data
INFO[01-25|10:54:59] Path Logs                                logger=settings path=/usr/local/services/grafana/data/log
INFO[01-25|10:54:59] Path Plugins                             logger=settings path=/usr/local/services/grafana/data/plugins
INFO[01-25|10:54:59] Initializing DB                          logger=sqlstore dbtype=sqlite3
INFO[01-25|10:54:59] Starting DB migration                    logger=migrator
INFO[01-25|10:54:59] Executing migration                      logger=migrator id="create migration_log table"
INFO[01-25|10:54:59] Executing migration                      logger=migrator id="create user table"
INFO[01-25|10:54:59] Executing migration                      logger=migrator id="add unique index user.login"
INFO[01-25|10:54:59] Executing migration                      logger=migrator id="add unique index user.email"
INFO[01-25|10:54:59] Executing migration                      logger=migrator id="drop index UQE_user_login - v1"
INFO[01-25|10:54:59] Executing migration                      logger=migrator id="drop index UQE_user_email - v1"
INFO[01-25|10:54:59] Executing migration                      logger=migrator id="Rename table user to user_v1 - v1"
INFO[01-25|10:54:59] Executing migration                      logger=migrator id="create user table v2"
INFO[01-25|10:54:59] Executing migration                      logger=migrator id="create index UQE_user_login - v2"
INFO[01-25|10:54:59] Executing migration                      logger=migrator id="create index UQE_user_email - v2"
INFO[01-25|10:54:59] Executing migration                      logger=migrator id="copy data_source v1 to v2"
INFO[01-25|10:54:59] Executing migration                      logger=migrator id="Drop old table user_v1"
INFO[01-25|10:54:59] Executing migration                      logger=migrator id="Add column help_flags1 to user table"
INFO[01-25|10:54:59] Executing migration                      logger=migrator id="Update user table charset"
INFO[01-25|10:54:59] Executing migration                      logger=migrator id="create temp user table v1-7"
INFO[01-25|10:54:59] Executing migration                      logger=migrator id="create index IDX_temp_user_email - v1-7"
INFO[01-25|10:54:59] Executing migration                      logger=migrator id="create index IDX_temp_user_org_id - v1-7"
INFO[01-25|10:54:59] Executing migration                      logger=migrator id="create index IDX_temp_user_code - v1-7"
INFO[01-25|10:54:59] Executing migration                      logger=migrator id="create index IDX_temp_user_status - v1-7"
INFO[01-25|10:54:59] Executing migration                      logger=migrator id="Update temp_user table charset"
INFO[01-25|10:54:59] Executing migration                      logger=migrator id="create star table"
INFO[01-25|10:54:59] Executing migration                      logger=migrator id="add unique index star.user_id_dashboard_id"
INFO[01-25|10:54:59] Executing migration                      logger=migrator id="create org table v1"
INFO[01-25|10:54:59] Executing migration                      logger=migrator id="create index UQE_org_name - v1"
INFO[01-25|10:54:59] Executing migration                      logger=migrator id="create org_user table v1"
INFO[01-25|10:54:59] Executing migration                      logger=migrator id="create index IDX_org_user_org_id - v1"
INFO[01-25|10:54:59] Executing migration                      logger=migrator id="create index UQE_org_user_org_id_user_id - v1"
INFO[01-25|10:54:59] Executing migration                      logger=migrator id="copy data account to org"
INFO[01-25|10:54:59] Skipping migration condition not fulfilled logger=migrator id="copy data account to org"
INFO[01-25|10:54:59] Executing migration                      logger=migrator id="copy data account_user to org_user"
INFO[01-25|10:54:59] Skipping migration condition not fulfilled logger=migrator id="copy data account_user to org_user"
INFO[01-25|10:54:59] Executing migration                      logger=migrator id="Drop old table account"
INFO[01-25|10:54:59] Executing migration                      logger=migrator id="Drop old table account_user"
INFO[01-25|10:54:59] Executing migration                      logger=migrator id="Update org table charset"
INFO[01-25|10:54:59] Executing migration                      logger=migrator id="Update org_user table charset"
INFO[01-25|10:54:59] Executing migration                      logger=migrator id="create dashboard table"
INFO[01-25|10:54:59] Executing migration                      logger=migrator id="add index dashboard.account_id"
INFO[01-25|10:54:59] Executing migration                      logger=migrator id="add unique index dashboard_account_id_slug"
INFO[01-25|10:54:59] Executing migration                      logger=migrator id="create dashboard_tag table"
INFO[01-25|10:54:59] Executing migration                      logger=migrator id="add unique index dashboard_tag.dasboard_id_term"
INFO[01-25|10:54:59] Executing migration                      logger=migrator id="drop index UQE_dashboard_tag_dashboard_id_term - v1"
INFO[01-25|10:54:59] Executing migration                      logger=migrator id="Rename table dashboard to dashboard_v1 - v1"
INFO[01-25|10:54:59] Executing migration                      logger=migrator id="create dashboard v2"
INFO[01-25|10:54:59] Executing migration                      logger=migrator id="create index IDX_dashboard_org_id - v2"
INFO[01-25|10:54:59] Executing migration                      logger=migrator id="create index UQE_dashboard_org_id_slug - v2"
INFO[01-25|10:54:59] Executing migration                      logger=migrator id="copy dashboard v1 to v2"
INFO[01-25|10:54:59] Executing migration                      logger=migrator id="drop table dashboard_v1"
INFO[01-25|10:54:59] Executing migration                      logger=migrator id="alter dashboard.data to mediumtext v1"
INFO[01-25|10:54:59] Executing migration                      logger=migrator id="Add column updated_by in dashboard - v2"
INFO[01-25|10:54:59] Executing migration                      logger=migrator id="Add column created_by in dashboard - v2"
INFO[01-25|10:54:59] Executing migration                      logger=migrator id="Add column gnetId in dashboard"
INFO[01-25|10:54:59] Executing migration                      logger=migrator id="Add index for gnetId in dashboard"
INFO[01-25|10:54:59] Executing migration                      logger=migrator id="Add column plugin_id in dashboard"
INFO[01-25|10:54:59] Executing migration                      logger=migrator id="Add index for plugin_id in dashboard"
INFO[01-25|10:54:59] Executing migration                      logger=migrator id="Add index for dashboard_id in dashboard_tag"
INFO[01-25|10:54:59] Executing migration                      logger=migrator id="Update dashboard table charset"
INFO[01-25|10:54:59] Executing migration                      logger=migrator id="Update dashboard_tag table charset"
INFO[01-25|10:54:59] Executing migration                      logger=migrator id="create data_source table"
INFO[01-25|10:54:59] Executing migration                      logger=migrator id="add index data_source.account_id"
INFO[01-25|10:54:59] Executing migration                      logger=migrator id="add unique index data_source.account_id_name"
INFO[01-25|10:54:59] Executing migration                      logger=migrator id="drop index IDX_data_source_account_id - v1"
INFO[01-25|10:54:59] Executing migration                      logger=migrator id="drop index UQE_data_source_account_id_name - v1"
INFO[01-25|10:54:59] Executing migration                      logger=migrator id="Rename table data_source to data_source_v1 - v1"
INFO[01-25|10:54:59] Executing migration                      logger=migrator id="create data_source table v2"
INFO[01-25|10:54:59] Executing migration                      logger=migrator id="create index IDX_data_source_org_id - v2"
INFO[01-25|10:54:59] Executing migration                      logger=migrator id="create index UQE_data_source_org_id_name - v2"
INFO[01-25|10:54:59] Executing migration                      logger=migrator id="copy data_source v1 to v2"
INFO[01-25|10:54:59] Executing migration                      logger=migrator id="Drop old table data_source_v1 #2"
INFO[01-25|10:54:59] Executing migration                      logger=migrator id="Add column with_credentials"
INFO[01-25|10:54:59] Executing migration                      logger=migrator id="Add secure json data column"
INFO[01-25|10:54:59] Executing migration                      logger=migrator id="Update data_source table charset"
INFO[01-25|10:54:59] Executing migration                      logger=migrator id="create api_key table"
INFO[01-25|10:54:59] Executing migration                      logger=migrator id="add index api_key.account_id"
INFO[01-25|10:54:59] Executing migration                      logger=migrator id="add index api_key.key"
INFO[01-25|10:54:59] Executing migration                      logger=migrator id="add index api_key.account_id_name"
INFO[01-25|10:54:59] Executing migration                      logger=migrator id="drop index IDX_api_key_account_id - v1"
INFO[01-25|10:54:59] Executing migration                      logger=migrator id="drop index UQE_api_key_key - v1"
INFO[01-25|10:54:59] Executing migration                      logger=migrator id="drop index UQE_api_key_account_id_name - v1"
INFO[01-25|10:54:59] Executing migration                      logger=migrator id="Rename table api_key to api_key_v1 - v1"
INFO[01-25|10:54:59] Executing migration                      logger=migrator id="create api_key table v2"
INFO[01-25|10:54:59] Executing migration                      logger=migrator id="create index IDX_api_key_org_id - v2"
INFO[01-25|10:54:59] Executing migration                      logger=migrator id="create index UQE_api_key_key - v2"
INFO[01-25|10:54:59] Executing migration                      logger=migrator id="create index UQE_api_key_org_id_name - v2"
INFO[01-25|10:54:59] Executing migration                      logger=migrator id="copy api_key v1 to v2"
INFO[01-25|10:54:59] Executing migration                      logger=migrator id="Drop old table api_key_v1"
INFO[01-25|10:54:59] Executing migration                      logger=migrator id="Update api_key table charset"
INFO[01-25|10:54:59] Executing migration                      logger=migrator id="create dashboard_snapshot table v4"
INFO[01-25|10:54:59] Executing migration                      logger=migrator id="drop table dashboard_snapshot_v4 #1"
INFO[01-25|10:54:59] Executing migration                      logger=migrator id="create dashboard_snapshot table v5 #2"
INFO[01-25|10:54:59] Executing migration                      logger=migrator id="create index UQE_dashboard_snapshot_key - v5"
INFO[01-25|10:54:59] Executing migration                      logger=migrator id="create index UQE_dashboard_snapshot_delete_key - v5"
INFO[01-25|10:54:59] Executing migration                      logger=migrator id="create index IDX_dashboard_snapshot_user_id - v5"
INFO[01-25|10:54:59] Executing migration                      logger=migrator id="alter dashboard_snapshot to mediumtext v2"
INFO[01-25|10:54:59] Executing migration                      logger=migrator id="Update dashboard_snapshot table charset"
INFO[01-25|10:54:59] Executing migration                      logger=migrator id="create quota table v1"
INFO[01-25|10:54:59] Executing migration                      logger=migrator id="create index UQE_quota_org_id_user_id_target - v1"
INFO[01-25|10:54:59] Executing migration                      logger=migrator id="Update quota table charset"
INFO[01-25|10:54:59] Executing migration                      logger=migrator id="create plugin_setting table"
INFO[01-25|10:54:59] Executing migration                      logger=migrator id="create index UQE_plugin_setting_org_id_plugin_id - v1"
INFO[01-25|10:54:59] Executing migration                      logger=migrator id="Add column plugin_version to plugin_settings"
INFO[01-25|10:54:59] Executing migration                      logger=migrator id="Update plugin_setting table charset"
INFO[01-25|10:54:59] Executing migration                      logger=migrator id="create session table"
INFO[01-25|10:54:59] Executing migration                      logger=migrator id="Drop old table playlist table"
INFO[01-25|10:54:59] Executing migration                      logger=migrator id="Drop old table playlist_item table"
INFO[01-25|10:54:59] Executing migration                      logger=migrator id="create playlist table v2"
INFO[01-25|10:54:59] Executing migration                      logger=migrator id="create playlist item table v2"
INFO[01-25|10:54:59] Executing migration                      logger=migrator id="Update playlist table charset"
INFO[01-25|10:54:59] Executing migration                      logger=migrator id="Update playlist_item table charset"
INFO[01-25|10:54:59] Executing migration                      logger=migrator id="drop preferences table v2"
INFO[01-25|10:54:59] Executing migration                      logger=migrator id="drop preferences table v3"
INFO[01-25|10:54:59] Executing migration                      logger=migrator id="create preferences table v3"
INFO[01-25|10:54:59] Executing migration                      logger=migrator id="Update preferences table charset"
INFO[01-25|10:54:59] Executing migration                      logger=migrator id="create alert table v1"
INFO[01-25|10:54:59] Executing migration                      logger=migrator id="add index alert org_id & id "
INFO[01-25|10:54:59] Executing migration                      logger=migrator id="add index alert state"
INFO[01-25|10:54:59] Executing migration                      logger=migrator id="add index alert dashboard_id"
INFO[01-25|10:54:59] Executing migration                      logger=migrator id="create alert_notification table v1"
INFO[01-25|10:54:59] Executing migration                      logger=migrator id="Add column is_default"
INFO[01-25|10:54:59] Executing migration                      logger=migrator id="add index alert_notification org_id & name"
INFO[01-25|10:54:59] Executing migration                      logger=migrator id="Update alert table charset"
INFO[01-25|10:54:59] Executing migration                      logger=migrator id="Update alert_notification table charset"
INFO[01-25|10:54:59] Executing migration                      logger=migrator id="Drop old annotation table v4"
INFO[01-25|10:54:59] Executing migration                      logger=migrator id="create annotation table v5"
INFO[01-25|10:54:59] Executing migration                      logger=migrator id="add index annotation 0 v3"
INFO[01-25|10:54:59] Executing migration                      logger=migrator id="add index annotation 1 v3"
INFO[01-25|10:54:59] Executing migration                      logger=migrator id="add index annotation 2 v3"
INFO[01-25|10:54:59] Executing migration                      logger=migrator id="add index annotation 3 v3"
INFO[01-25|10:54:59] Executing migration                      logger=migrator id="add index annotation 4 v3"
INFO[01-25|10:54:59] Executing migration                      logger=migrator id="Update annotation table charset"
INFO[01-25|10:54:59] Executing migration                      logger=migrator id="Add column region_id to annotation table"
INFO[01-25|10:54:59] Executing migration                      logger=migrator id="create test_data table"
INFO[01-25|10:54:59] Created default admin user: admin
INFO[01-25|10:54:59] Creating json dashboard index for path: /var/lib/grafana/dashboards
INFO[01-25|10:54:59] Starting plugin search                   logger=plugins
WARN[01-25|10:54:59] Plugin dir does not exist                logger=plugins dir=/usr/local/services/grafana/data/plugins
INFO[01-25|10:54:59] Plugin dir created                       logger=plugins dir=/usr/local/services/grafana/data/plugins
INFO[01-25|10:54:59] Initializing Alerting                    logger=alerting.engine
INFO[01-25|10:54:59] Initializing CleanUpService              logger=cleanup
INFO[01-25|10:55:00] Initializing Stream Manager
INFO[01-25|10:55:00] Initializing HTTP Server                 logger=http.server address=0.0.0.0:3000 protocol=http subUrl= socket=
INFO[01-25|10:55:24] Request Completed                        logger=context userId=0 orgId=0 uname= method=GET path=/ status=302 remote_addr=127.0.0.1 time_ms=0 size=29
EROR[01-25|10:55:59] Failed to update dashboard json index lstat /var/lib/grafana/dashboards: no such file or directory
EROR[01-25|10:56:59] Failed to update dashboard json index lstat /var/lib/grafana/dashboards: no such file or directory
EROR[01-25|10:57:59] Failed to update dashboard json index lstat /var/lib/grafana/dashboards: no such file or directory
EROR[01-25|10:58:59] Failed to update dashboard json index lstat /var/lib/grafana/dashboards: no such file or directory
EROR[01-25|10:59:59] Failed to update dashboard json index lstat /var/lib/grafana/dashboards: no such file or directory
EROR[01-25|11:00:59] Failed to update dashboard json index lstat /var/lib/grafana/dashboards: no such file or directory
EROR[01-25|11:01:59] Failed to update dashboard json index lstat /var/lib/grafana/dashboards: no such file or directory
EROR[01-25|11:02:59] Failed to update dashboard json index lstat /var/lib/grafana/dashboards: no such file or directory
EROR[01-25|11:03:59] Failed to update dashboard json index lstat /var/lib/grafana/dashboards: no such file or directory
EROR[01-25|11:04:59] Failed to update dashboard json index lstat /var/lib/grafana/dashboards: no such file or directory
EROR[01-25|11:05:59] Failed to update dashboard json index lstat /var/lib/grafana/dashboards: no such file or directory
EROR[01-25|11:06:59] Failed to update dashboard json index lstat /var/lib/grafana/dashboards: no such file or directory
EROR[01-25|11:07:59] Failed to update dashboard json index lstat /var/lib/grafana/dashboards: no such file or directory
EROR[01-25|11:08:59] Failed to update dashboard json index lstat /var/lib/grafana/dashboards: no such file or directory
Explode a lot of errors, look at the general error information, that is no / var/lib/grafana/dashboards directory, the vernacular point is that you configure the program to / var/lib/grafana/dashboards directory to find json files actually do not have this directory, so you can not find it, and then check, it is true that / fanvar / lib / GraA does not have dashboards, json files are in / var / var / lib / graboards directory, and json files are in / var / var / lib / dashboards directory. Under lib/grafana, the configuration information is then configured to:
################### Dashboard JSON files ################
[dashboards.json]
enabled = true
path = /var/lib/grafana
Successfully loading dashboard, this is because of the configuration of path =/var/lib/grafana, you should pay attention to when installing, and if there is a problem, start all the components with the console, do not start in the background, so that the problem will be reported directly, not to look at the logs one by one, wait for no problem to run in the background, I hope it will help you all.