Preface
Arcgis is a platform of geographic system, which can be used for data display or secondary development. What we are using here is Arcgis to develop the JavaScript api, that is, the web-side api. The version we used was 3.21, which included the API of the complete 2D map. If you want to develop a 3D map, you can use the 4.4 version of the api. In this demo, we need to complete the following functions:
- Basic Map Display
- Search function
- Graph drawing
- Graphic Click Display Details
- Graph deletion
You can see the download link for this example at the end of this blog.
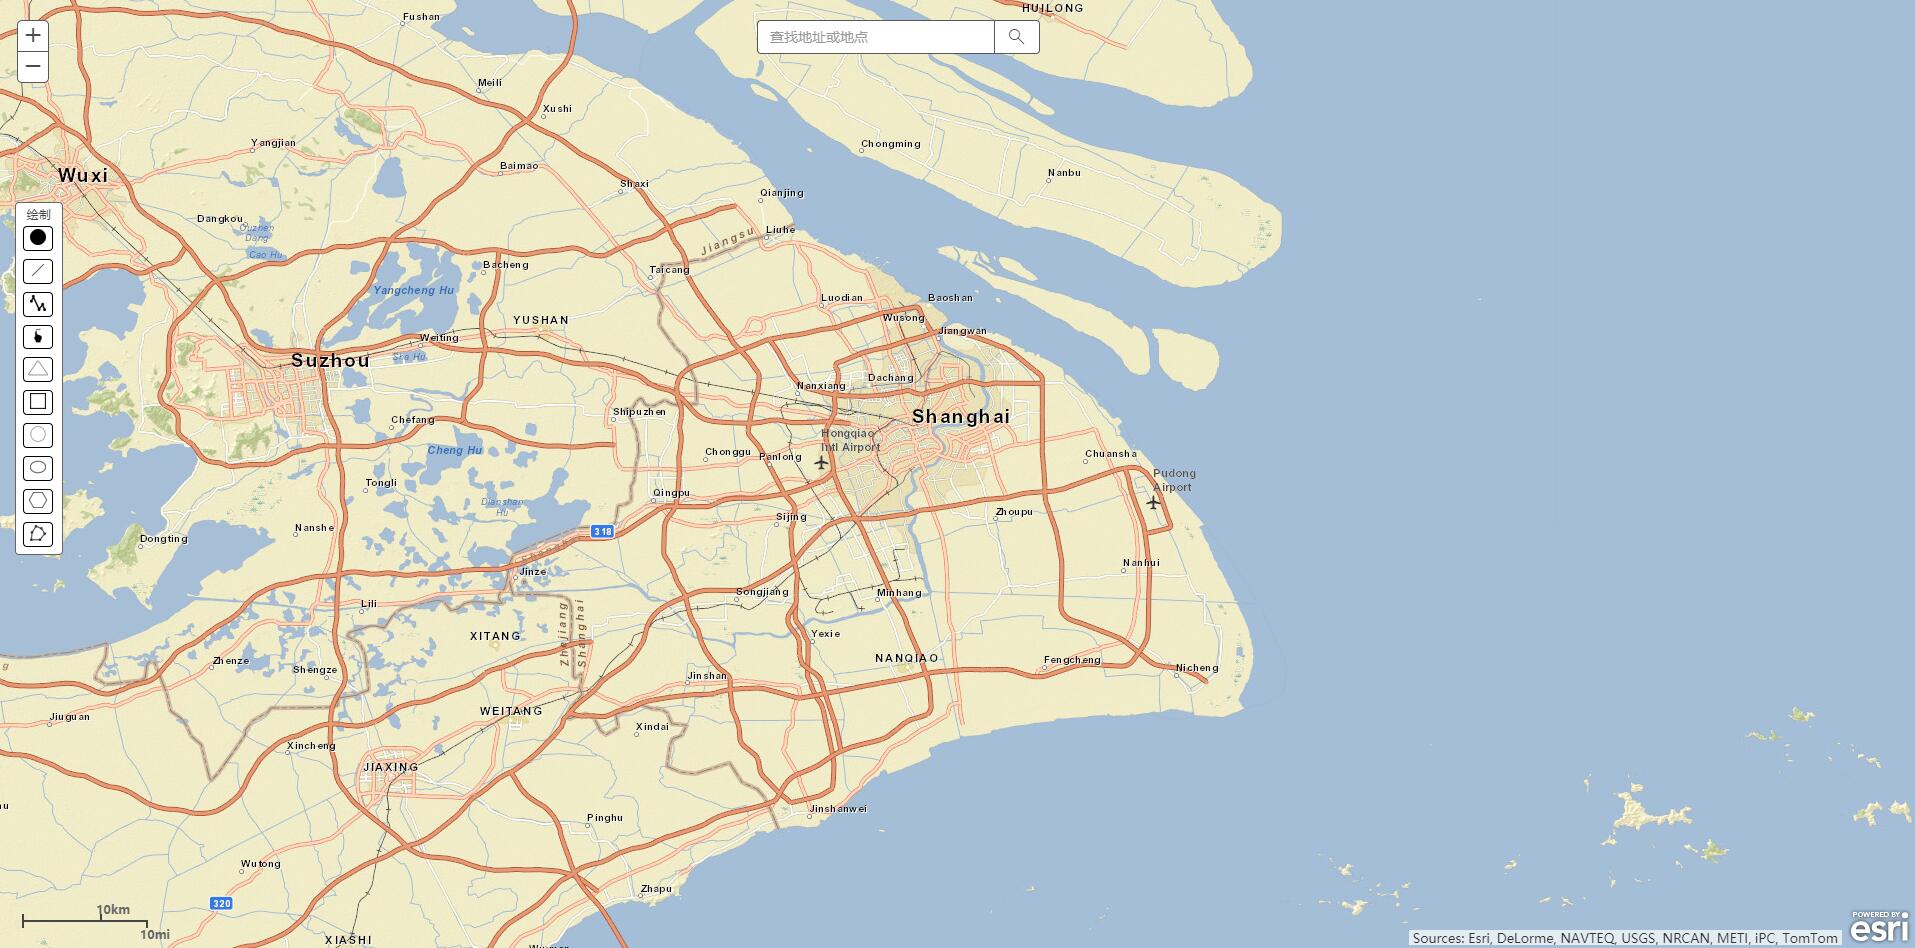
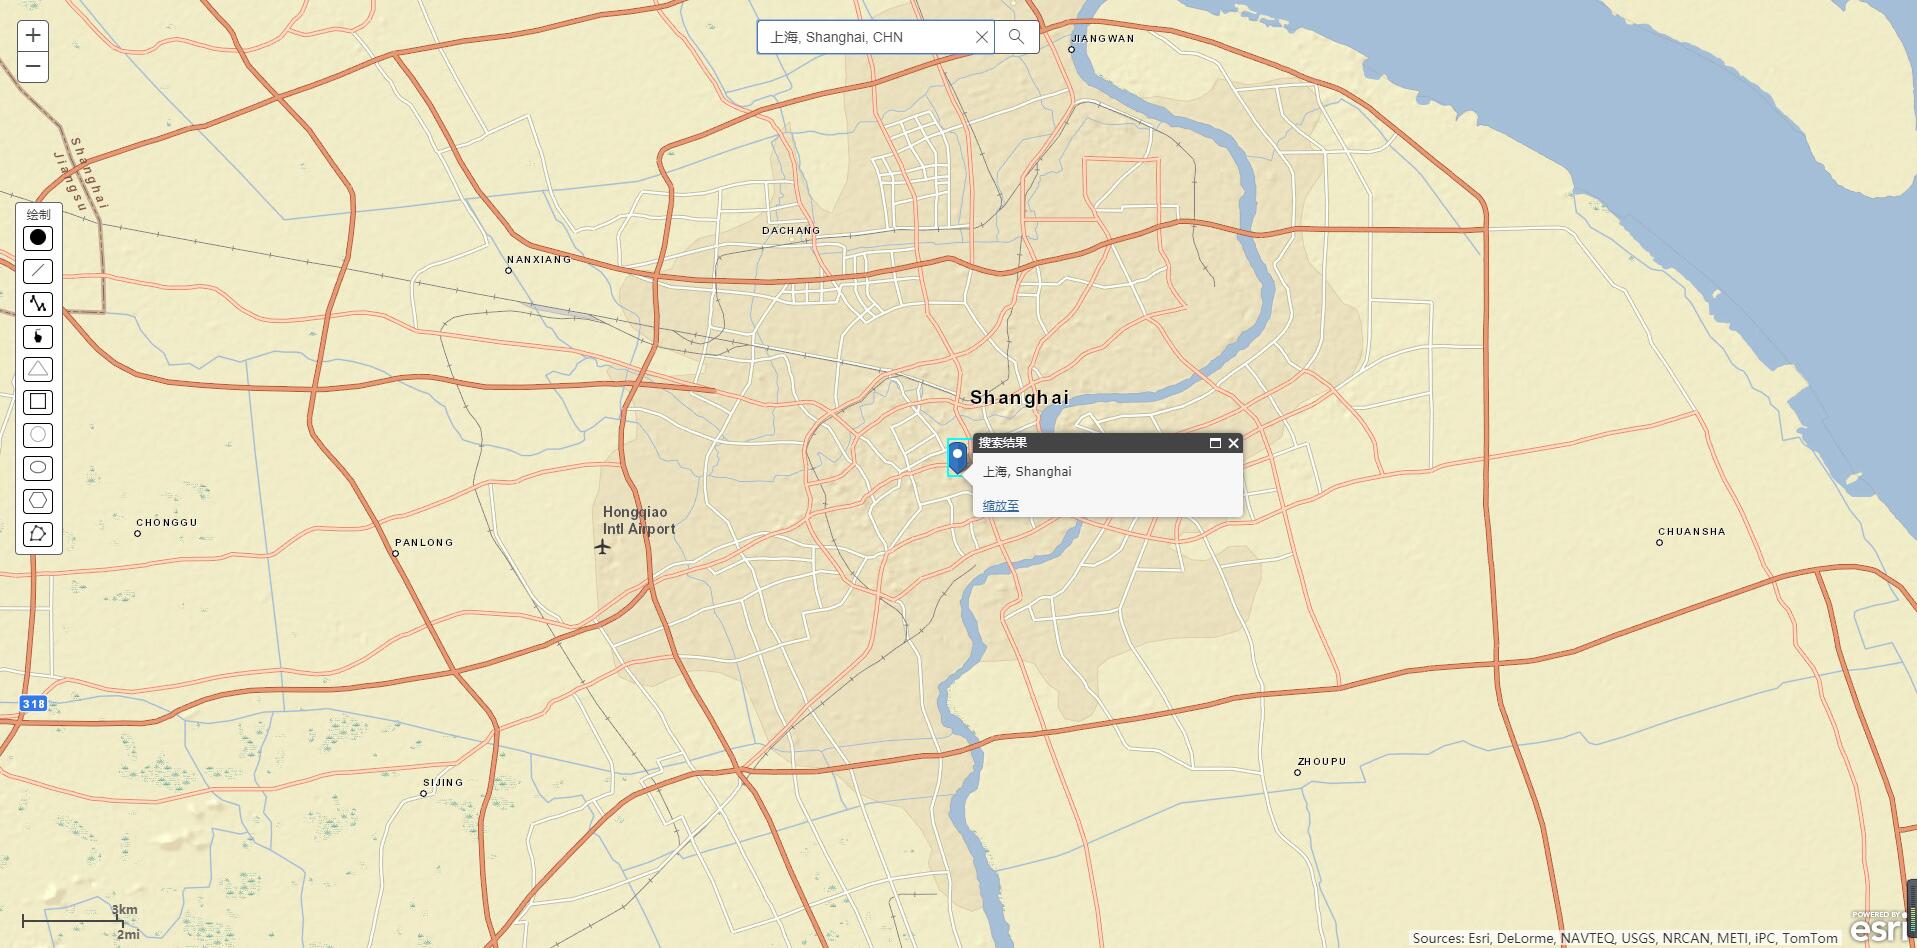
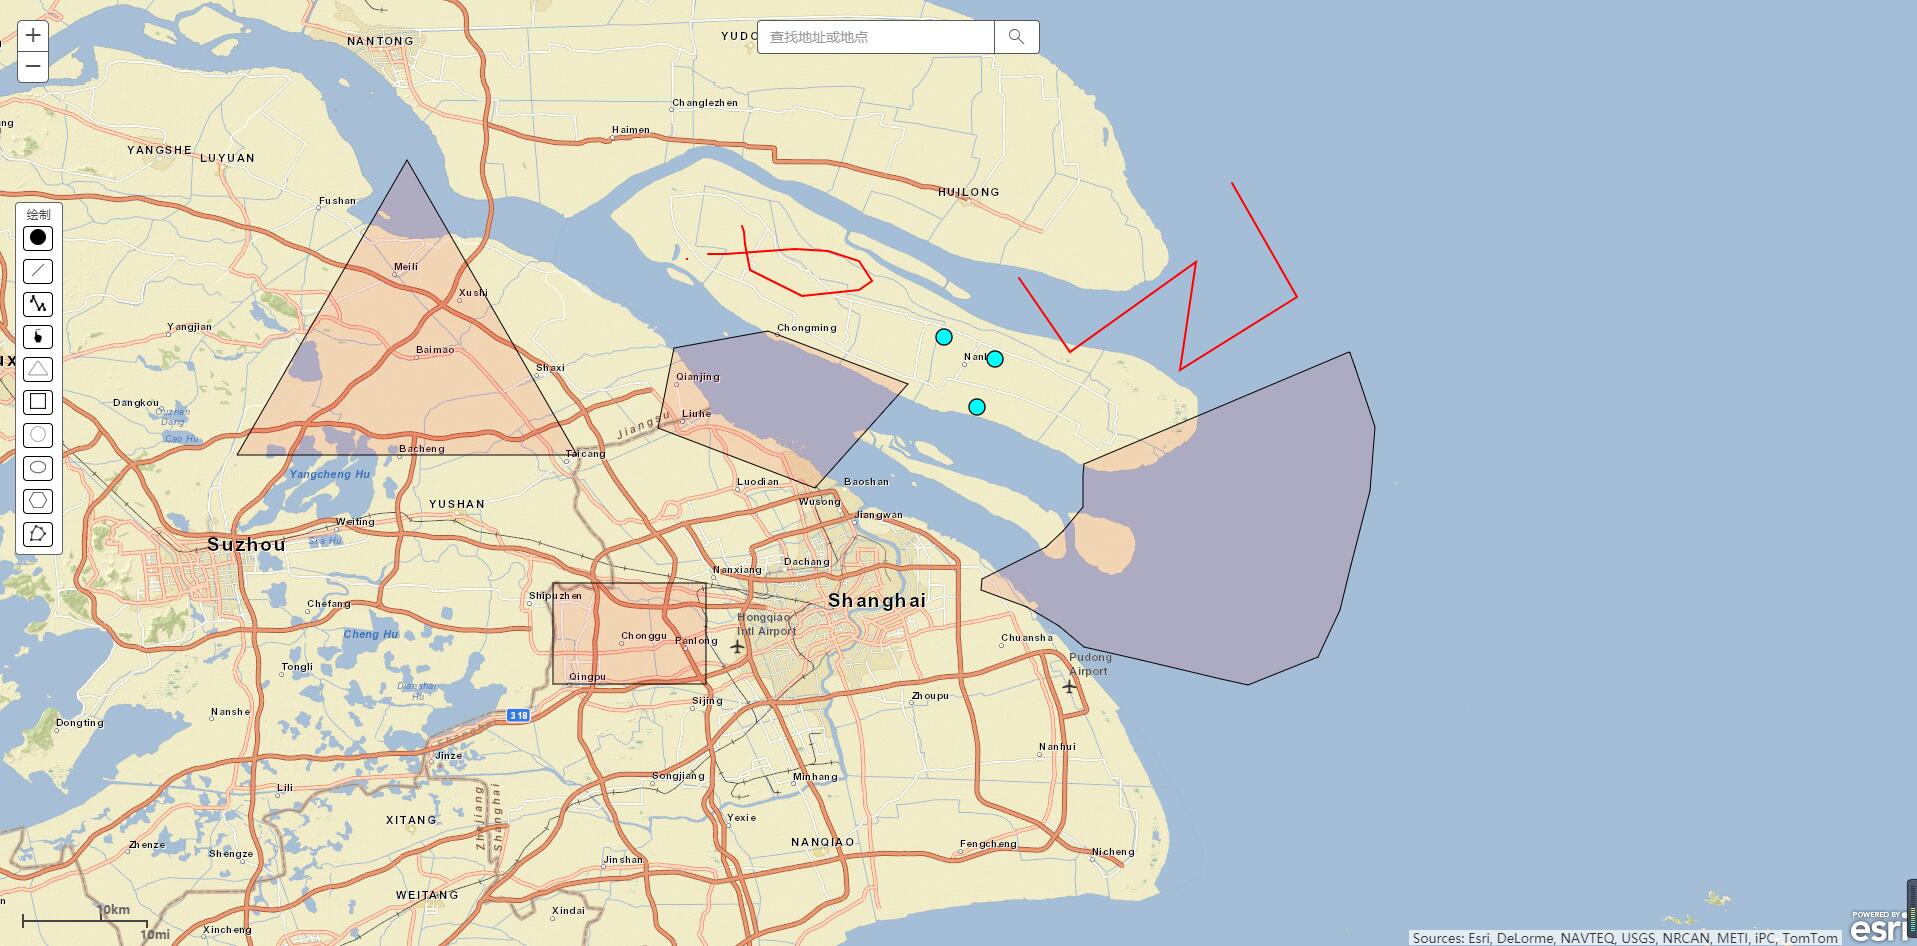
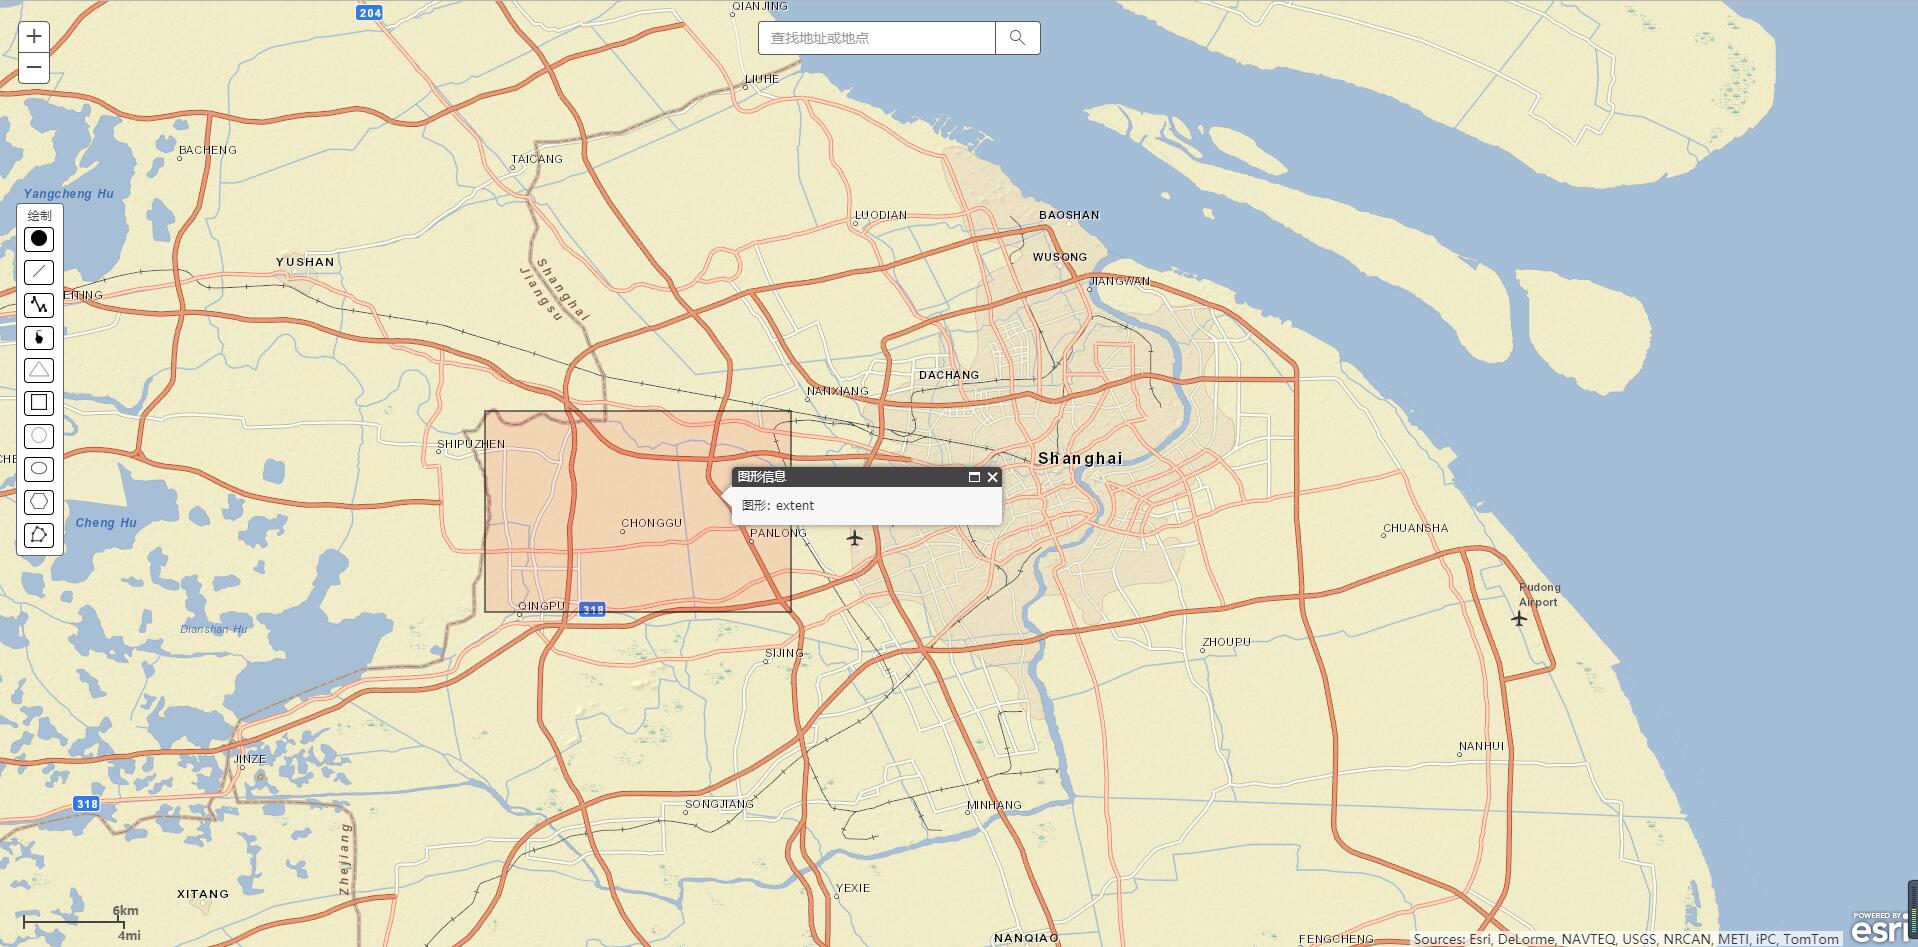
Let's start with a screenshot of the program:
First, when the page opens:
Next, when using the search function:
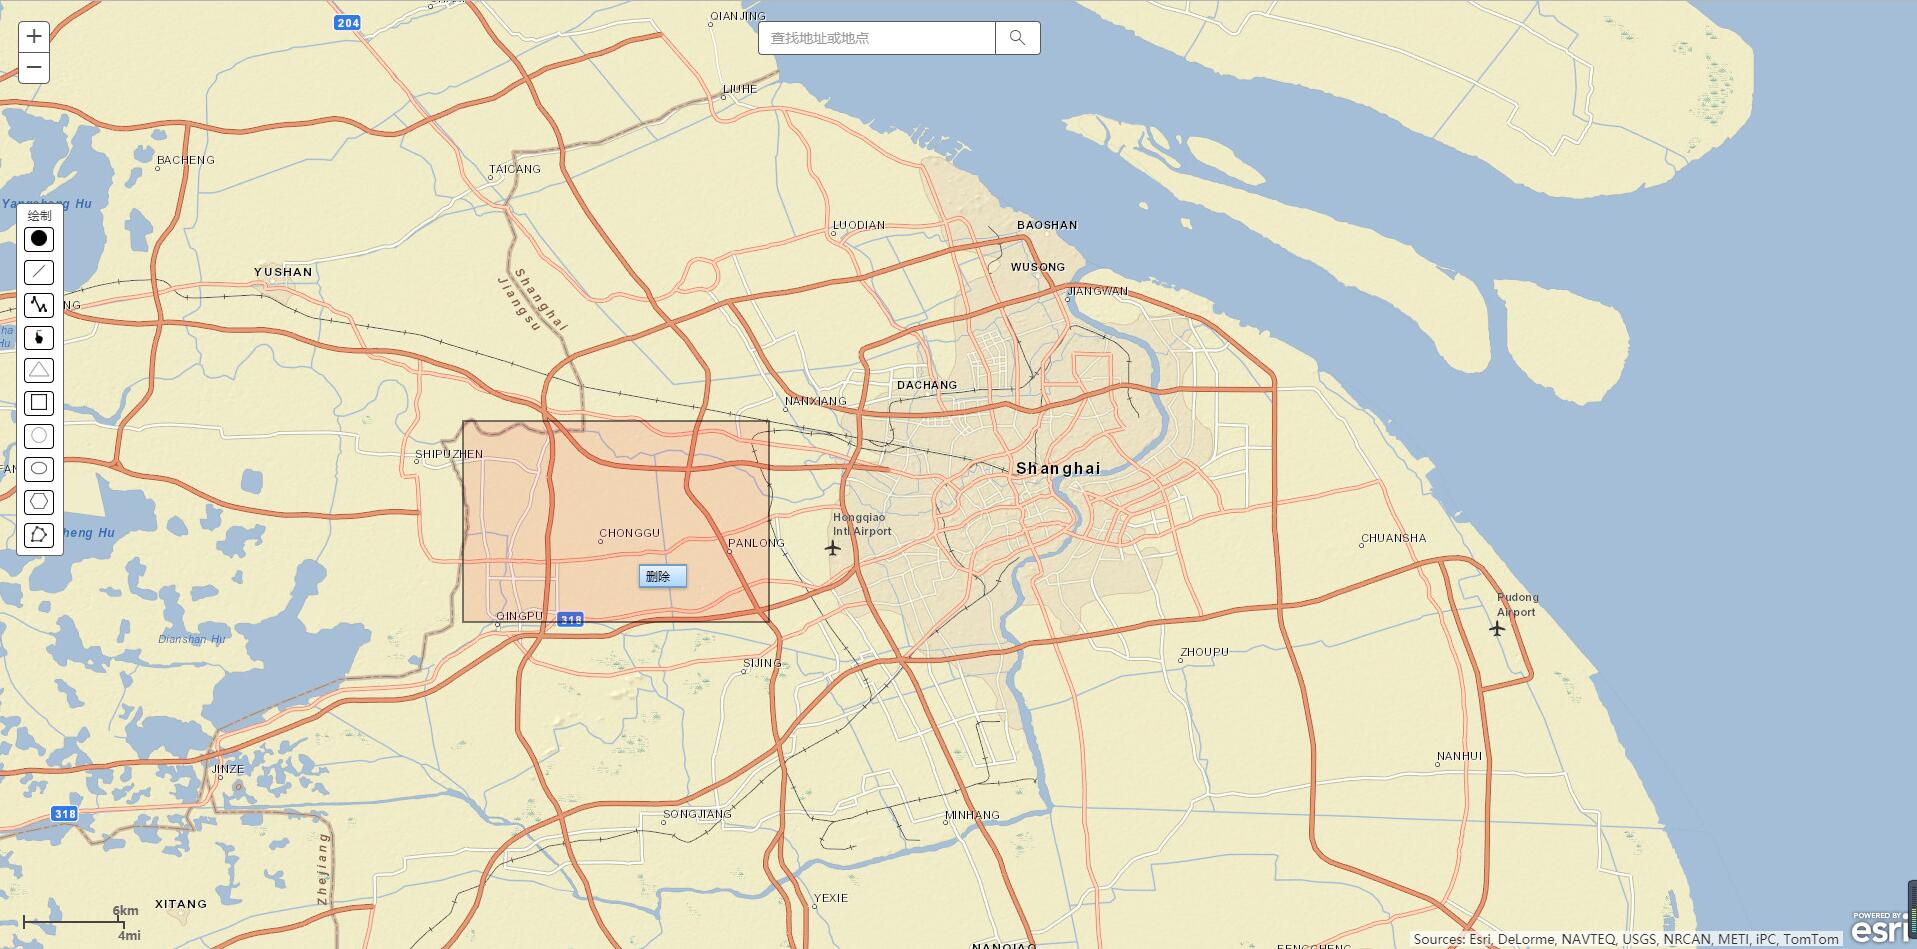
Drawn graphics:
Left-click graphics to generate popup:
The delete button pops up when you right-click on the graph:
Code
Next is the complete code of the program. In addition to introducing arcGIS package, jquery package is also introduced. jqeury is not necessary in this case, but mainly used for the development of later examples.
<!DOCTYPE html>
<html>
<head>
    <meta http-equiv="Content-Type" content="text/html; charset=utf-8">
    <meta name="viewport" content="initial-scale=1, maximum-scale=1, user-scalable=no">
    <title>Arcgis Demo</title>
    <link rel="stylesheet" href="https://js.arcgis.com/3.21/dijit/themes/claro/claro.css">
    <link rel="stylesheet" href="https://js.arcgis.com/3.21/esri/css/esri.css">

    <style>
        html, body, #map {
            height: 100%; width: 100%; margin: 0; padding: 0;
        }

        #search {
            z-index: 20;
            margin: auto;
            height: 95px;
            width: 400px;
            margin: auto;
            position: absolute;
            top: 20px;
            left: 0;
            right: 0;
        }

        #info {
            top: 200px;
            color: #444;
            height: auto;
            font-family: arial;
            left: 16px;
            margin: 2px;
            padding: 3px;
            position: absolute;
            width: 40px;
            z-index: 40;
            border: solid 1px #666;
            border-radius: 4px;
            background-color: #fff;
        }

        html, body, #mapDiv {
            padding:0;
            margin:0;
            height:100%;
        }

        #info button {
            background-color: white;
            padding: 2px;
            text-align: center;
            margin: 4px 4px;
            cursor: pointer;
            border-radius: 4px;
            width: 30px;
            border: 1px solid
        }

        #info button:hover {
            padding: 2px;
            text-align: center;
            margin: 4px 4px;
            cursor: pointer;
            border-radius: 4px;
            width: 30px;
            border: 1px solid #1e90ff;
            color: #1e90ff;
        }

    </style>

    <script src="https://js.arcgis.com/3.21/"></script>
    <script src="https://cdn.bootcss.com/jquery/1.10.2/jquery.min.js"></script>
    <script>

        var map, tb, ctxMenuForGraphics;
        var selected;

        require([
            "esri/map",
            "esri/layers/ArcGISTiledMapServiceLayer",
            "esri/layers/ArcGISDynamicMapServiceLayer",
            "dojo/_base/connect",
            "esri/dijit/BasemapToggle",
            "esri/toolbars/draw",
            "esri/geometry/Polygon",
            "esri/geometry/Polyline",
            "esri/dijit/Search",
            "dijit/registry",
            "esri/dijit/Scalebar",
            "esri/symbols/SimpleMarkerSymbol",
            "esri/symbols/SimpleFillSymbol",
            "esri/symbols/PictureFillSymbol",
            "esri/symbols/CartographicLineSymbol",
            "esri/symbols/PictureMarkerSymbol",
            "esri/geometry/Extent",
            "esri/SpatialReference",
            "esri/geometry/Point",
            "esri/geometry/mathUtils",
            "esri/geometry/ScreenPoint",
            "esri/toolbars/edit",
            "dijit/Menu",
            "dijit/MenuItem",
            "dijit/MenuSeparator",
            "esri/graphic",
            "esri/layers/GraphicsLayer",
            "esri/Color",
            "esri/dijit/Popup",
            "esri/dijit/PopupTemplate",
            "esri/InfoTemplate",
            "esri/symbols/SimpleLineSymbol",
            "dojo/dom-construct",
            "dojo/dom",
            "dojo/on",
            "dojo/domReady!"
        ], function(
            Map,  ArcGISTiledMapServiceLayer, ArcGISDynamicMapServiceLayer,
            connect, BasemapToggle, Draw, Polygon, Polyline, Search, registry, Scalebar, SimpleMarkerSymbol, SimpleFillSymbol,
            PictureFillSymbol, CartographicLineSymbol, PictureMarkerSymbol,
            Extent, SpatialReference, Point, mathUtils, ScreenPoint, Edit, Menu, MenuItem, MenuSeparator,
            Graphic, GraphicsLayer, Color, Popup, PopupTemplate, InfoTemplate, SimpleLineSymbol, domConstruct,
            dom, on, domAttr
        ) {
            //Create popup popup layer
            var popup = new Popup(null, domConstruct.create("div"));

            //Map
            map = new Map("map", {
                center: [121.47003707885744, 31.24853148977224],
                zoom: 7,
                infoWindow: popup,
                extent: new Extent(-122.68,45.53,-122.45,45.60, new SpatialReference({ wkid:4326 }))
            });

            //Add map layers
            var mapServiceURL = "https://server.arcgisonline.com/ArcGIS/rest/services/ESRI_StreetMap_World_2D/MapServer";
            map.addLayer(new ArcGISTiledMapServiceLayer(mapServiceURL));

            //Initialization scale
            var scalebar = new Scalebar({
                map: map,
                attachTo: "bottom-left",
                scalebarUnit: "dual",
            });

            //Display scale
            scalebar.show();

            //Create Layer
            var gl = new GraphicsLayer({ id: "draw" });
            map.addLayer(gl);

            map.on("load", initToolbar);

            createGraphicsMenu();

            //Create a right-click menu
            function createGraphicsMenu() {
                ctxMenuForGraphics = new Menu({});

                ctxMenuForGraphics.addChild(new MenuItem({
                    label: "delete",
                    onClick: function () {
                        gl.remove(selected)
                    }
                }));

                //Click events that bind the gl layer when the mouse is over the graph
                gl.on("mouse-over", function(evt) {
                    selected = evt.graphic;
                    ctxMenuForGraphics.bindDomNode(evt.graphic.getDojoShape().getNode());
                });

                //Unbound the click event when the mouse moves over the gl layer's graph
                gl.on("mouse-out", function(evt) {
                    ctxMenuForGraphics.unBindDomNode(evt.graphic.getDojoShape().getNode());
                });
            }

            //Start the right-click menu
            ctxMenuForGraphics.startup();

            //Click on Map Response
            map.on("click", function(e) {
                //Hide popup by clicking on the blank
                if(e.graphic == undefined){
                    popup.hide();
                }
            });

            //Search box
            var search = new Search({
                map: map,
                graphicsLayer: gl,
            }, "search");
            search.startup();

            //Pop-up box information
            gl.on("click",  function(e) {
                var detailInfo = 'Graphical: '  + e.graphic.geometry.cache.geoShape + '<br>'
                popup.setTitle('Graphic information');
                popup.setContent(detailInfo);
                popup.show(e.mapPoint);
            });


            //Symbols used to show points
            var markerSymbol = new SimpleMarkerSymbol();
            markerSymbol.setColor(new Color("#00FFFF"));

            // Symbols used to show lines
            var lineSymbol = new CartographicLineSymbol(
                CartographicLineSymbol.STYLE_SOLID,
                new Color([255,0,0]), 2,
                CartographicLineSymbol.CAP_ROUND,
                CartographicLineSymbol.JOIN_MITER, 5
            );

            //Symbols for presentation
            var fillSymbol = new SimpleFillSymbol(
                SimpleFillSymbol.STYLE_SOLID,
                new SimpleLineSymbol(
                    SimpleLineSymbol.STYLE_SOLID,
                    new Color('#000'),
                    1
                ),
                new Color([255, 0, 0, 0.1])
            );

            //Initialization toolbar
            function initToolbar() {
                tb = new Draw(map);
                tb.on("draw-end", addGraphic);

                on(dom.byId("info"), "click", function(evt) {
                    if ( evt.target.id === "info" ) {
                        return;
                    }
                    var tool = evt.target.id.toLowerCase();
                    map.disableMapNavigation();
                    tb.activate(tool);
                });
            }

            //Add graphics
            function addGraphic(evt) {
                tb.deactivate();
                map.enableMapNavigation();

                var symbol;
                if ( evt.geometry.type === "point" || evt.geometry.type === "multipoint") {
                    symbol = markerSymbol;
                } else if ( evt.geometry.type === "line" || evt.geometry.type === "polyline") {
                    symbol = lineSymbol;
                }
                else {
                    symbol = fillSymbol;
                }

                evt.geometry.setCacheValue("geoShape", evt.geometry.type);

                gl.add(new Graphic(evt.geometry, symbol));
            }
        });
    </script>
</head>


<body  class="claro" style="font-size: 0.75em;">

    <div id="info">
        <div align="center">Draw</div>
        <button id="Multipoint"><image id="Multipoint" src = "../images/point.png"></image></button>
        <button id="Line"><image id="Line" src = "../images/line.png"></image></button>
        <button id="Polyline"><image id="Polyline" src = "../images/line_chart.png"></image></button>
        <button id="FreehandPolyline"><image id="FreehandPolyline" src = "../images/draw.png"></image></button>
        <button id="Triangle"><image id="Triangle" src = "../images/triangle.png"></image></button>
        <button id="Extent"><image id="Extent" src = "../images/rectangle.png"></image></button>
        <button id="Circle"><image id="Circle" src = "../images/circle.png"></image></button>
        <button id="Ellipse"><image id="Ellipse" src = "../images/ellipse.png"></image></button>
        <button id="Polygon"><image id="Polygon" src = "../images/polygon.png"></image></button>
        <button id="FreehandPolygon"><image id="FreehandPolygon" src = "../images/free_polygon.png"></image></button>
    </div>


    <div id="search"></div>

    <div id="map" data-dojo-type="dijit/layout/ContentPane" data-dojo-props="region:'center'">

    </div>

</body>
</html>
Simply describe the process: First create the popup instance, then create the map instance, and designate the popup layer of the map as the newly created popup instance. Then create map layer and draw layer, add map layer and draw layer to map instance. Initialize the Drawing toolbar and the right-click menu when the map is loaded, and bind the events of the toolbar and the right-click menu to the drawing layer, so that the drawing and deletion of the graph will be done on the drawing layer. Then initialize the search box.
Specific function descriptions are written in the comments.
Concluding remarks
In this case, the basic calls to arcGIS api are also some basic operations. The code in this example has been uploaded to My github . After downloading, decompress and use the browser to open ArcgisDemo.html under the html folder to see the effect. If you have questions about the code, you can leave a message on your blog.