background
One module of airline ticket business has a data volume of 1 billion +, and the amount of writing, updating and deleting is relatively low. According to KEY query some data, each query returns about 10,000 records.
It is such a simple requirement that the business side finds that reading has become a huge bottleneck, returning 10,000 requests per time, 100 concurrent requests per second, 1 million requests per second (about 500 MB). The main bottleneck is:
1. Network is a big expense.
2. Data of different KEY may be stored dispersedly. IO amplification in the presence of queries may have some performance impact.
3. The number of returned records per request is large, and the possible overhead of database search buffer calls will increase.
On these issues, let's look at how to optimize or solve the business side's problems.
modeling
1. Build tables
create table test(
  id int,
  info text,    -- Some attributes, I'll use a field here to represent it.
  typeid int,   -- Categories are also user query filtering conditions. There are about 100,000 categories with 10,000 records per category, totaling 1 billion records.
  crt_time timestamp,  -- Creation time
  mod_time timestamp  -- Modification time
);
2. Insert test data
insert into test select generate_series(1,1000000000), 'test', random()*99999, now();
3. Create index
create index idx_test_typeid on test (typeid);
4. Original SQL request
select * from test where typeid=?;

About 10,000 records were returned.
Understanding data distribution
postgres=# select schemaname, tablename, attname, correlation from pg_stats where tablename='test';
 schemaname | tablename | attname  | correlation
------------+-----------+----------+-------------
 postgres   | test      | id       |           1
 postgres   | test      | info     |           1
 postgres   | test      | typeid   |   0.0122783
 postgres   | test      | crt_time |           1
 postgres   | test      | mod_time |
(5 rows)
Through pg_stats, we can see that the linear correlation between typeid and physical storage is only 0.012, which is very scattered.
When accessed by TYPEID, IO amplification is very serious, that is to say, 10,000 records may be scattered among 10,000 data blocks.
postgres=# explain (analyze,verbose,timing,costs,buffers) select * from test where typeid =1;
                                                                 QUERY PLAN
--------------------------------------------------------------------------------------------------------------------------------------------
 Index Scan using idx_test_typeid on postgres.test  (cost=0.57..13343.21 rows=10109 width=29) (actual time=0.029..14.283 rows=9935 loops=1)
   Output: id, info, typeid, crt_time, mod_time
   Index Cond: (test.typeid = 1)
   Buffers: shared hit=9959   -- typeid=1 Records are scattered among 9959 data blocks
 Planning time: 0.085 ms
 Execution time: 14.798 ms
(6 rows)
Performance Evaluation and Bottleneck Analysis of Original SQL
1. Pressure measurement
vi test.sql

\set typeid random(0,99999)
select * from test where typeid=:typeid;
Pressure measurement results, TPS 1653.
pgbench -M prepared -n -r -P 1 -f ./test.sql -c 64 -j 64 -T 120

transaction type: ./test.sql
scaling factor: 1
query mode: prepared
number of clients: 64
number of threads: 64
duration: 120 s
number of transactions actually processed: 198445
latency average = 38.699 ms
latency stddev = 7.898 ms
tps = 1653.239177 (including connections establishing)
tps = 1653.525600 (excluding connections establishing)
script statistics:
 - statement latencies in milliseconds:
         0.002  \set typeid random(0,99999)
        38.697  select * from test where typeid=:typeid;
2. Bottleneck of perf Observation
perf top -ag

  Children      Self  Shared Object              Symbol
+   15.31%    15.19%  postgres                   [.] hash_search_with_hash_value
+   14.48%     8.78%  postgres                   [.] heap_hot_search_buffer
+    9.95%     2.26%  [kernel]                   [k] page_fault
+    9.44%     8.24%  postgres                   [.] heap_page_prune_opt
+    7.67%     0.02%  [kernel]                   [k] do_page_fault
+    7.62%     0.21%  [kernel]                   [k] __do_page_fault
+    6.89%     0.41%  [kernel]                   [k] handle_mm_fault
+    6.87%     6.80%  postgres                   [.] PinBuffer
+    4.32%     0.18%  [kernel]                   [k] __do_fault
+    4.03%     4.00%  postgres                   [.] LWLockAcquire
+    3.83%     0.00%  [kernel]                   [k] system_call_fastpath
+    3.17%     3.15%  libc-2.17.so               [.] __memcpy_ssse3_back
+    3.01%     0.16%  [kernel]                   [k] shmem_fault
+    2.85%     0.13%  [kernel]                   [k] shmem_getpage_gfp
Optimizing Method 1, Clustering
1. PostgreSQL provides a clustering function that enables tables to be CLUSTER by index, i.e. rearranged.
The effect is that the linear correlation between the corresponding columns (or columns) and the physical order of the index becomes 1 or - 1, i. e. linear, which is exactly the same. When conditionally filtered by this field or these fields, the block of scanned heap table data is greatly reduced.
postgres=# cluster test using idx_test_typeid;

postgres=# \d test
                          Table "postgres.test"
  Column  |            Type             | Collation | Nullable | Default
----------+-----------------------------+-----------+----------+---------
 id       | integer                     |           |          |
 info     | text                        |           |          |
 typeid   | integer                     |           |          |
 crt_time | timestamp without time zone |           |          |
 mod_time | timestamp without time zone |           |          |
Indexes:
    "idx_test_typeid" btree (typeid) CLUSTER
2. After testing cluster, filter data by typeid, only 96 data blocks need to be scanned. The response time of SQL has also been reduced from 14.8 milliseconds to 1.9 milliseconds.
postgres=# explain (analyze,verbose,timing,costs,buffers) select * from test where typeid =1;
                                                                QUERY PLAN
-------------------------------------------------------------------------------------------------------------------------------------------
 Index Scan using idx_test_typeid on postgres.test  (cost=0.57..13343.21 rows=10109 width=29) (actual time=0.011..1.413 rows=9935 loops=1)
   Output: id, info, typeid, crt_time, mod_time
   Index Cond: (test.typeid = 1)
   Buffers: shared hit=96
 Planning time: 0.039 ms
 Execution time: 1.887 ms
(6 rows)
3. Pressure measurement, TPS 2715. Compared with the original performance, it improved by 64%.
pgbench -M prepared -n -r -P 1 -f ./test.sql -c 64 -j 64 -T 120

transaction type: ./test.sql
scaling factor: 1
query mode: prepared
number of clients: 64
number of threads: 64
duration: 120 s
number of transactions actually processed: 326188
latency average = 23.546 ms
latency stddev = 7.793 ms
tps = 2715.409760 (including connections establishing)
tps = 2715.677062 (excluding connections establishing)
script statistics:
 - statement latencies in milliseconds:
         0.002  \set typeid random(0,99999)
        23.543  select * from test where typeid=:typeid;
4. Bottleneck of perf Observation
User mode invocation is not in TOP.

+   14.30%     0.00%  [kernel]                      [k] system_call_fastpath
+    9.62%     1.26%  [kernel]                      [k] page_fault
+    8.35%     0.01%  [kernel]                      [k] do_page_fault
+    8.27%     0.14%  [kernel]                      [k] __do_page_fault
+    6.81%     0.37%  libc-2.17.so                  [.] sysmalloc
+    6.48%     0.10%  [kernel]                      [k] __alloc_pages_nodemask
+    5.84%     0.40%  [kernel]                      [k] handle_mm_fault
+    5.84%     0.05%  libpthread-2.17.so            [.] __libc_send
+    5.83%     5.79%  libc-2.17.so                  [.] __memcpy_ssse3_back
+    5.74%     0.03%  libpthread-2.17.so            [.] __libc_recv
1 summaries of optimization
1. Optimizing method 1 does not involve the optimization of reducing network overhead.
2. After using cluster, the problem of IO amplification is completely avoided.
3. But the number of records returned by each request is the same as the original, which has no effect on the database search buffer.
4. Aggregation is a static operation, and the database will not always maintain this state.
However, PG can set fillfactor to make the updated version as far as possible in the current data block. This method is very effective for updating. As long as the corresponding search KEY remains unchanged, the linear correlation can be maintained all the time. Invalid for new data. So clustering is especially suitable for relatively static data, or for scenarios where the old data is basically unchanged in the time dimension. We can use the time partition table to implement CLUSTER on the old data to ensure the linear correlation of the data.
alter table test set (fillfactor=80);
Optimizing Method 2, Aggregation
The goal of Optimize 2 is similar to that of Optimize 1, but aggregating the data into a single one and increasing the compression ratio of the data is only the compression of the database, so it has no effect on the reduction of network demand.
1. Aggregation, because there are few updates, we can aggregate multiple records into one record.
create table test_agg (typeid int, content jsonb);

insert into test_agg select typeid, jsonb_agg(jsonb_build_object('id',id,'info',info,'crt_time',crt_time,'mod_time',mod_time)) from test group by typeid;

create index idx_test_agg_1 on test_agg(typeid);
2. Query request
select * from test_agg where typeid=?
3. Add, delete and change.
The operation functions of JSON type are as follows:
https://www.postgresql.org/docs/10/static/functions-json.html
4. Optimized performance indicators
Pressure measurement, performance has not improved
vi test1.sql

\set typeid random(0,99999)
select * from test_agg where typeid=:typeid;

pgbench -M prepared -n -r -P 1 -f ./test1.sql -c 64 -j 64 -T 120

transaction type: ./test1.sql
scaling factor: 1
query mode: prepared
number of clients: 64
number of threads: 64
duration: 120 s
number of transactions actually processed: 151156
latency average = 50.803 ms
latency stddev = 2.913 ms
tps = 1258.934362 (including connections establishing)
tps = 1259.301582 (excluding connections establishing)
script statistics:
 - statement latencies in milliseconds:
         0.002  \set typeid random(0,99999)
        50.801  select * from test_agg where typeid=:typeid;
2 summaries of optimization
Performance has not improved, after converting to JSONB type, each ELEMETE adds header information, so the space of network transmission actually becomes larger.
......
{"id": 172264479, "info": "test", "crt_time": "2017-07-27T20:41:32.365209", "mod_time": null},
{"id": 172304687, "info": "test", "crt_time": "2017-07-27T20:41:32.365209", "mod_time": null},
......
This optimization method didn't make a profit.
Optimizing Method 3, Optimizing Network Transmission Compression
PostgreSQL supports SSL links and compressed and encrypted transport through SSL.
If the transmission bandwidth is limited, it is a good choice to use this link, but it will consume some CPU resources of client and database.
There are some examples:
PostgreSQL SSL Link Compression Example
PostgreSQL ssl ciphers performance comparison
Optimizing Method 4, Read-only Node
This optimization method is simple and effective, but some resources need to be invested. PostgreSQL supports two kinds of standby, physical and logical standby.
Physical standby is read-only and has low latency. No matter how big the transaction is, the latency is in milliseconds. But physical repositories can only be replicated in full repositories.
Logical standby is writable and can subscribe to some data at the same time, but with high latency (usually a subscription channel has a rate of 30,000 rows/s, and an instance can support multiple subscription channels, such as one subscription channel per table).
At the same time, it is recommended that the database node be as close as possible to the APPLICATION node network, and even that the standby be deployed on the business server.
Reference document:
PostgreSQL 10 Streaming Physics and Logic Master-Slave Best Practices
Optimize means 5, according to user segmentation, sharding.
According to user segmentation, the data is divided into several database instances.
According to the index of optimization method 1, each node can provide 1.3GB/s output flow. If it is divided into 16 nodes, it can support 21GB/s output flow. There's no need to think about standby at all.
The middle layer can consider the use of plproxy, middleware and other methods.
PostgreSQL Best Practices - Horizontal Library (Based on plproxy)
https://github.com/go-pg/sharding
Reference document
<PostgreSQL 9.6 sharding based on FDW & pg_pathman>
Summary
1. The original single-bar storage, users each request, returns 10,000 records, so the network bandwidth of the host and the enlargement of data access discrete IO of the database are major performance impediments.
cluster method is used to store data according to KEY, which completely eliminates the problem of IO amplification, and the performance improvement is very obvious.
With FILLFACTOR, updates of data can be done as far as possible in the current data block, thus not destroying the order of cluster ing. The problem of destroying linear correlation introduced by UPDATE is solved.
2. By clustering, the data that users need to access can be merged into a single line (or stored in sequence) to reduce the number of scanned data blocks. Query efficiency has been greatly improved.
By expanding the bandwidth or adding a small amount of backup, it can meet the needs of the business side.
3. PostgreSQL supports a variety of aggregation methods, arrays, KV, JSON.
But aggregation brings another problem, the DML of data becomes very troublesome.
4. By aggregating, the queried data are close together, which makes the data compression ratio higher, eliminates the problem of the original IO enlargement, and reduces the extra cost of code jump introduced by multiple records.
5. After aggregation, data can be added, deleted and changed by UDF. PostgreSQL's plpgsql function is very powerful, similar to Oracle's PL/SQL. At the same time, PostgreSQL also supports UDF languages such as pljava and plpython, which is convenient for more developers to use.
Finally, the recommended optimization methods are as follows:
1,cluster
2, network compression
3, read and write separation
4,sharding
The proposed optimal combination is 1 + 4, or 1 + 3.
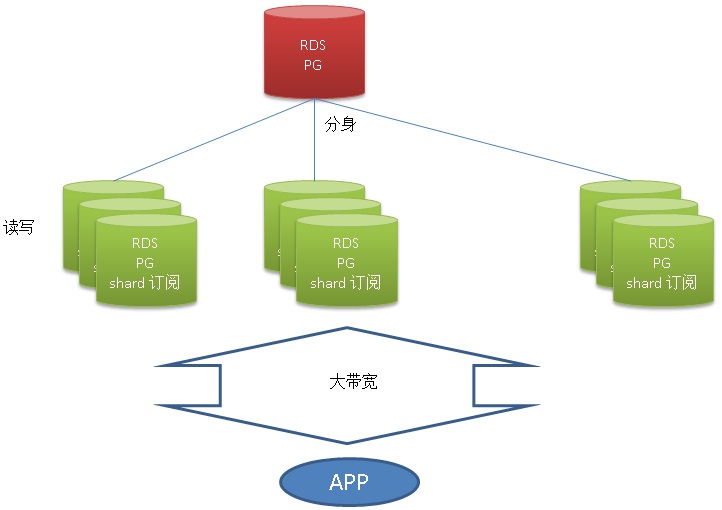
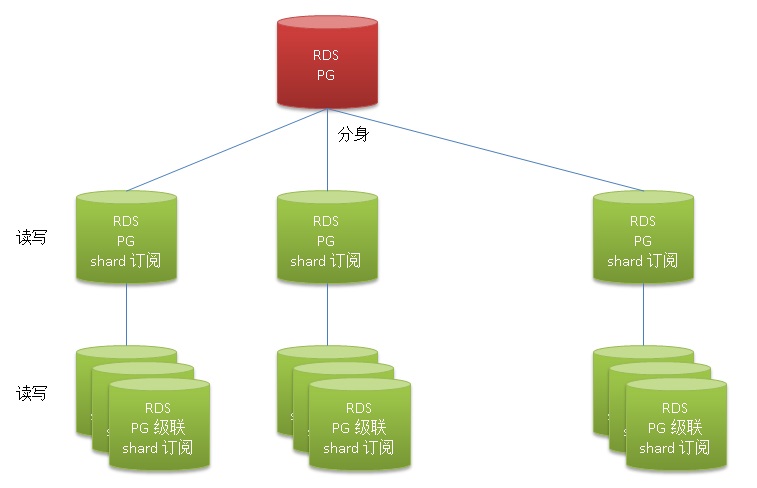
Some alternative architectures:
1. A database stores all the data and provides reading and writing. Logical subscription is used to separate data into multiple copies and provide reading and writing.
2. A database stores the full amount of data and provides reading and writing. Logical subscription is used to separate data into multiple copies and provide reading and writing. Cascaded logical subscription is adopted to create more read-write logical subscription libraries.
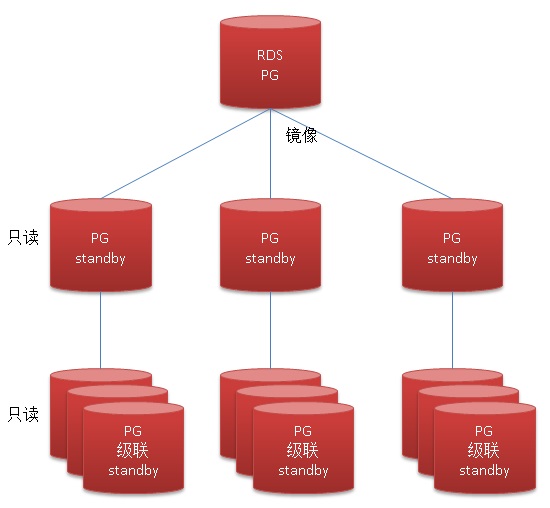
3. A database stores all the data and provides reading and writing. Logical subscription is used to separate data into multiple copies and provide reading and writing. Using cascaded physical stream replication, more mirror-only backup libraries are created.
4. A database stores the full amount of data and provides reading and writing. A stack of mirror-only backup libraries is created by physical stream replication.
5. A database stores the full amount of data and provides reading and writing. A stack of mirror-only backup libraries is created by physical stream replication. Using cascaded physical stream replication, more mirror-only backup libraries are created.
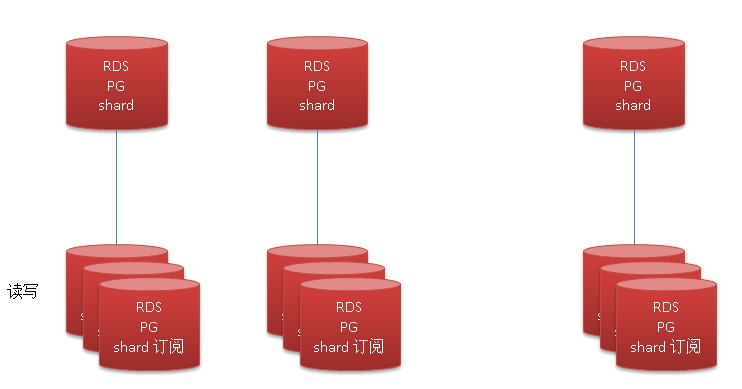
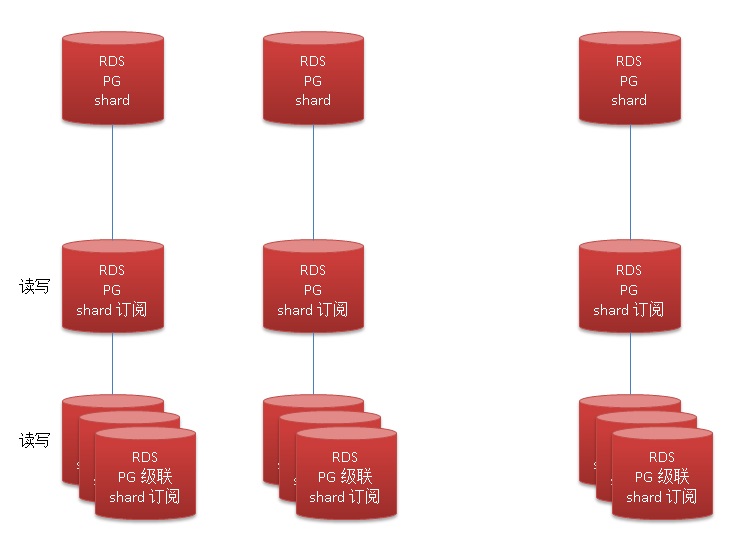
6. Front-end shard, multiple databases store the full amount of data, providing reading and writing. Use logical subscription, complete mirror, provide read and write.
7. Front-end shard, multiple databases store the full amount of data, providing reading and writing. Use logical subscription, complete mirror, provide read and write. Cascaded logical subscription is adopted to create more read-write logical subscription libraries.
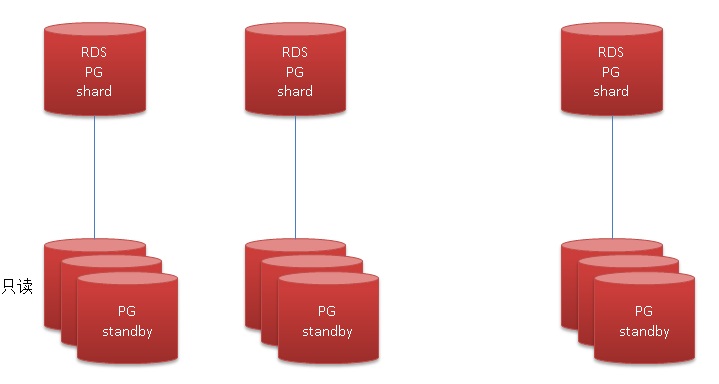
8. Front-end shard, multiple databases store the full amount of data, providing reading and writing. The physical stream replication method is used to create a read-only standby. Using cascaded physical stream replication, more mirror-only backup libraries are created.
9. Front-end shard, multiple databases store the full amount of data, providing reading and writing. A stack of read-only standby libraries is created by physical stream replication.
Reference resources
PostgreSQL 10 Streaming Physics and Logic Master-Slave Best Practices
sharding Middleware
https://github.com/dangdangdotcom/sharding-jdbc
https://github.com/go-pg/sharding/
PostgreSQL Best Practices - Horizontal Library (Based on plproxy)
