Logistic Regression is a classification model in machine learning. Logistic Regression is a classification algorithm. Although the name contains regression, it has a certain relationship with regression. Because the algorithm is simple and efficient, it is widely used in practice.
1 application scenario of logistic regression
- Advertising click through rate
- Is it spam
- Are you sick
- financial fraud
- False account number
Looking at the above example, we can find the characteristic, that is, the judgment between the two categories. Logistic regression is a sharp tool to solve the problem of binary classification
2 principle of logistic regression
To master logistic regression, you must master two points:
What is the input value in logistic regression
How to judge the output of logistic regression
2.1 input
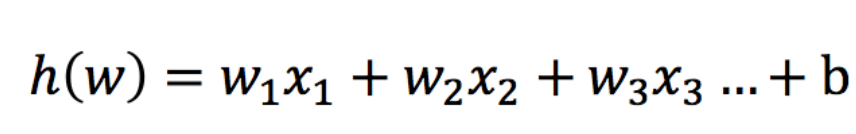
The input of logistic regression is the result of linear regression.
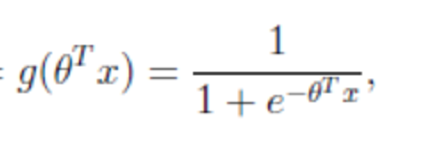
2.2 activation function
-
sigmoid function
-
Judgment criteria
- The result of the regression is input into the sigmoid function
- Output result: a probability value in the [0, 1] interval. The default value is 0.5, which is the threshold value

- The final classification of logistic regression is to judge whether it belongs to a category through the probability value of belonging to a category, and this category is marked as 1 (positive example) by default, and the other category will be marked as 0 (negative example). (to facilitate loss calculation)
Interpretation of output results (important): it is assumed that there are two categories A and B, and our probability value is the probability value belonging to category A(1). Now there is a sample input to the logistic regression output result of 0.6, then the probability value exceeds 0.5, which means that the result of our training or prediction is category A(1). On the contrary, if the result is 0.3, the training or prediction result is category B(0).
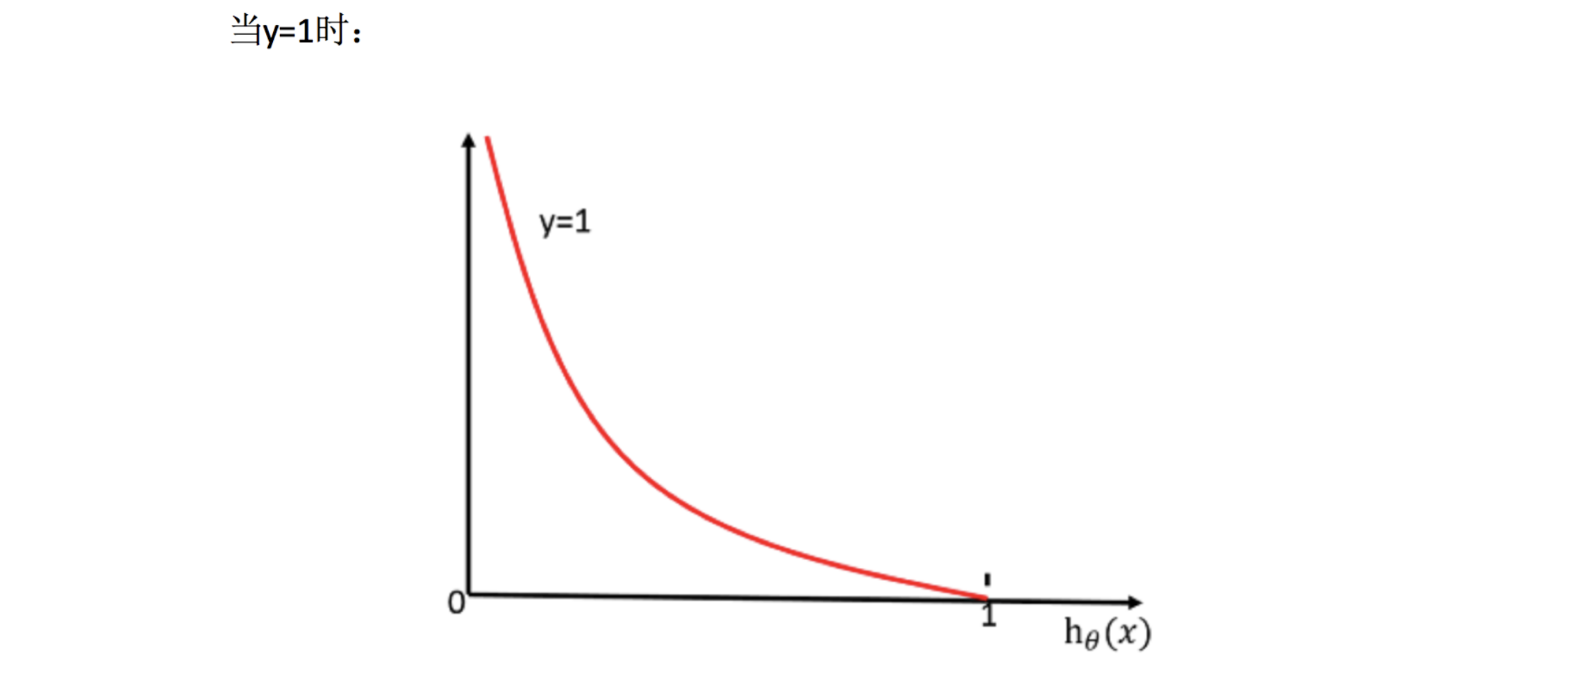
So next, let's recall the previous linear regression prediction results. We use the mean square error to measure. If the logistic regression prediction results are wrong, how to measure the loss? Let's look at such a picture
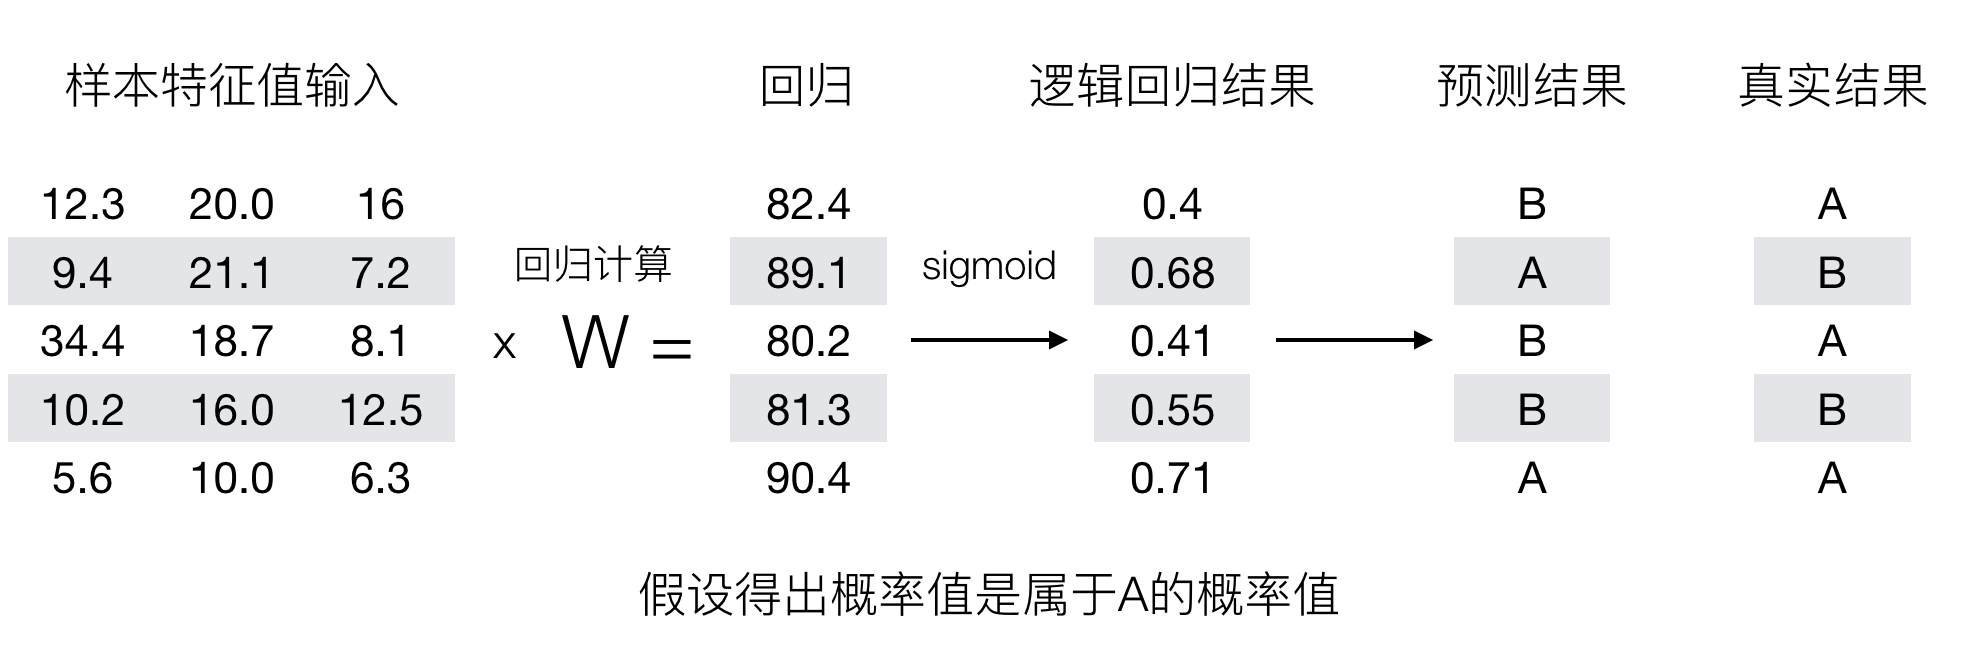
So how to measure the difference between the predicted results of logistic regression and the real results?
3 loss and optimization
3.1 loss
The loss of logistic regression is called log likelihood loss, and the formula is as follows:
- Separate categories:
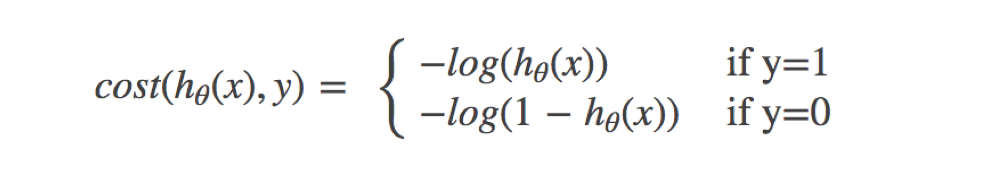
How to understand a single formula? This should be understood according to the function image of log
- Integrated complete loss function
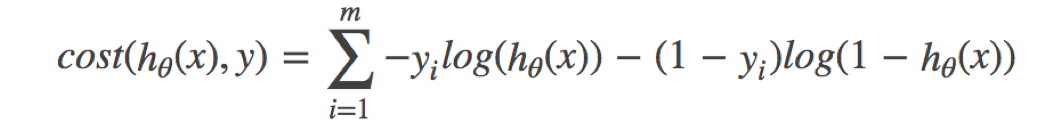
Seeing this formula is actually similar to our information entropy.
Next, let's take the above example to calculate, and then we can understand the meaning.
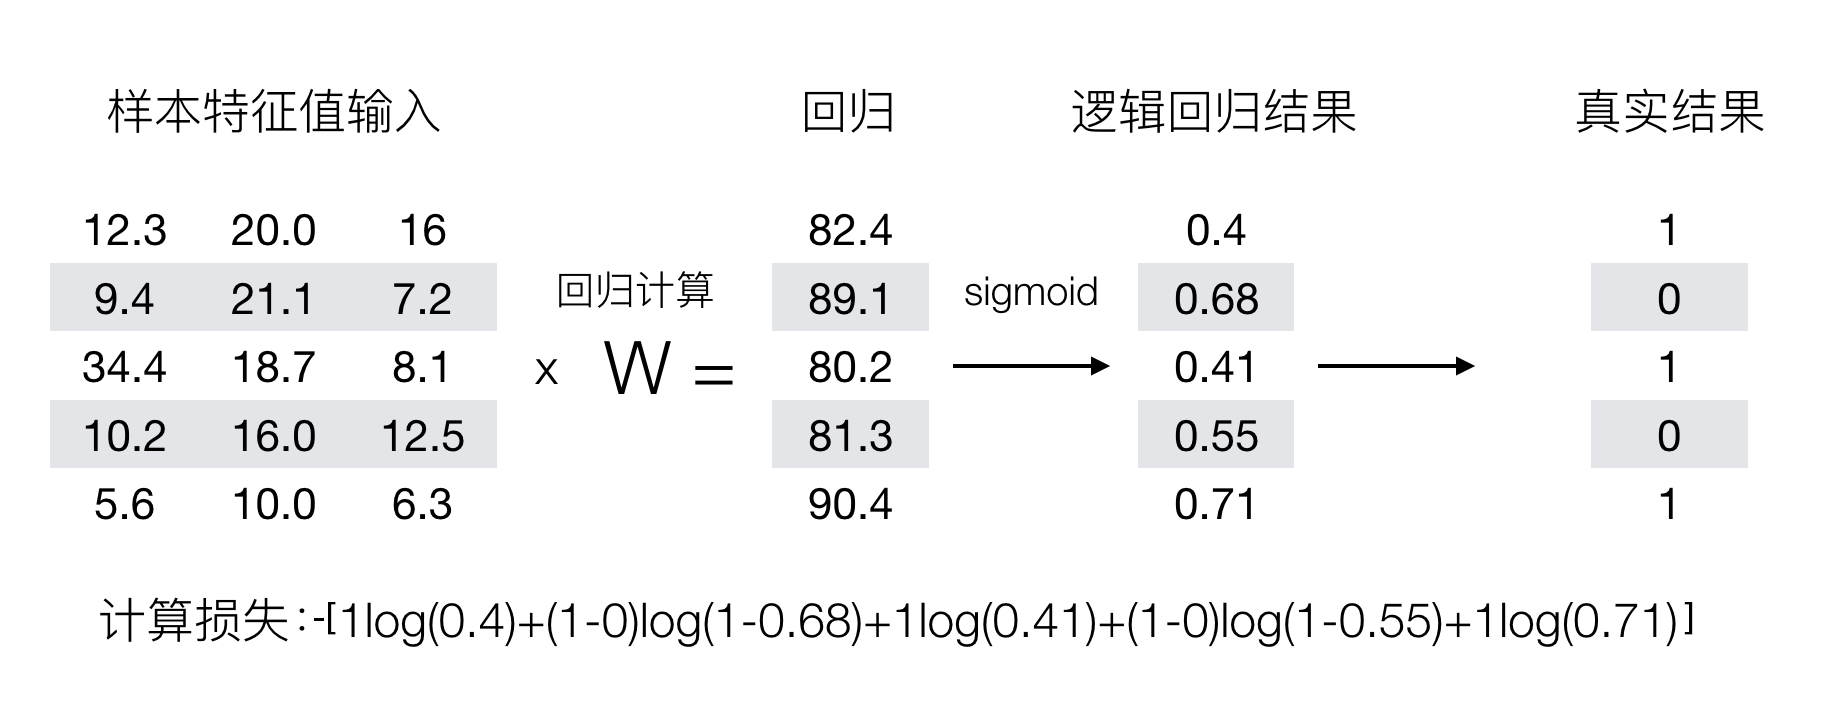
We already know that the larger the value of log (P), the smaller the result, so we can analyze this loss formula
3.2 optimization
The gradient descent optimization algorithm is also used to reduce the value of the loss function. In this way, the weight parameters of the previous corresponding algorithm of logistic regression are updated to improve the probability of originally belonging to category 1 and reduce the probability of originally belonging to category 0.
4. Introduction to logistic regression api
-
sklearn.linear_model.LogisticRegression(solver='liblinear', penalty='l2', C = 1.0)
-
solver optional parameters: {liblinear ',' sag ',' saga ',' Newton CG ',' lbfgs'},
- Default: 'liblinear'; Algorithms for optimization problems.
-
"liblinear" is a good choice for small data sets, while "sag" and "saga" are faster for large data sets.
-
For multi class problems, only 'Newton CG', 'sag', 'saga' and 'lbfgs' can handle multiple losses; "liblinear" is limited to the "one verse rest" category.
-
penalty: type of regularization
-
C: Regularization strength
-
By default, those with a small number of categories are taken as positive examples
The LogisticRegression method is equivalent to sgdclassifier (loss = "log", penalty = ""), which implements a common random gradient descent learning. Instead, LogisticRegression is used (sag is implemented)
5: case: cancer classification prediction - benign / malignant breast cancer prediction
- Data introduction
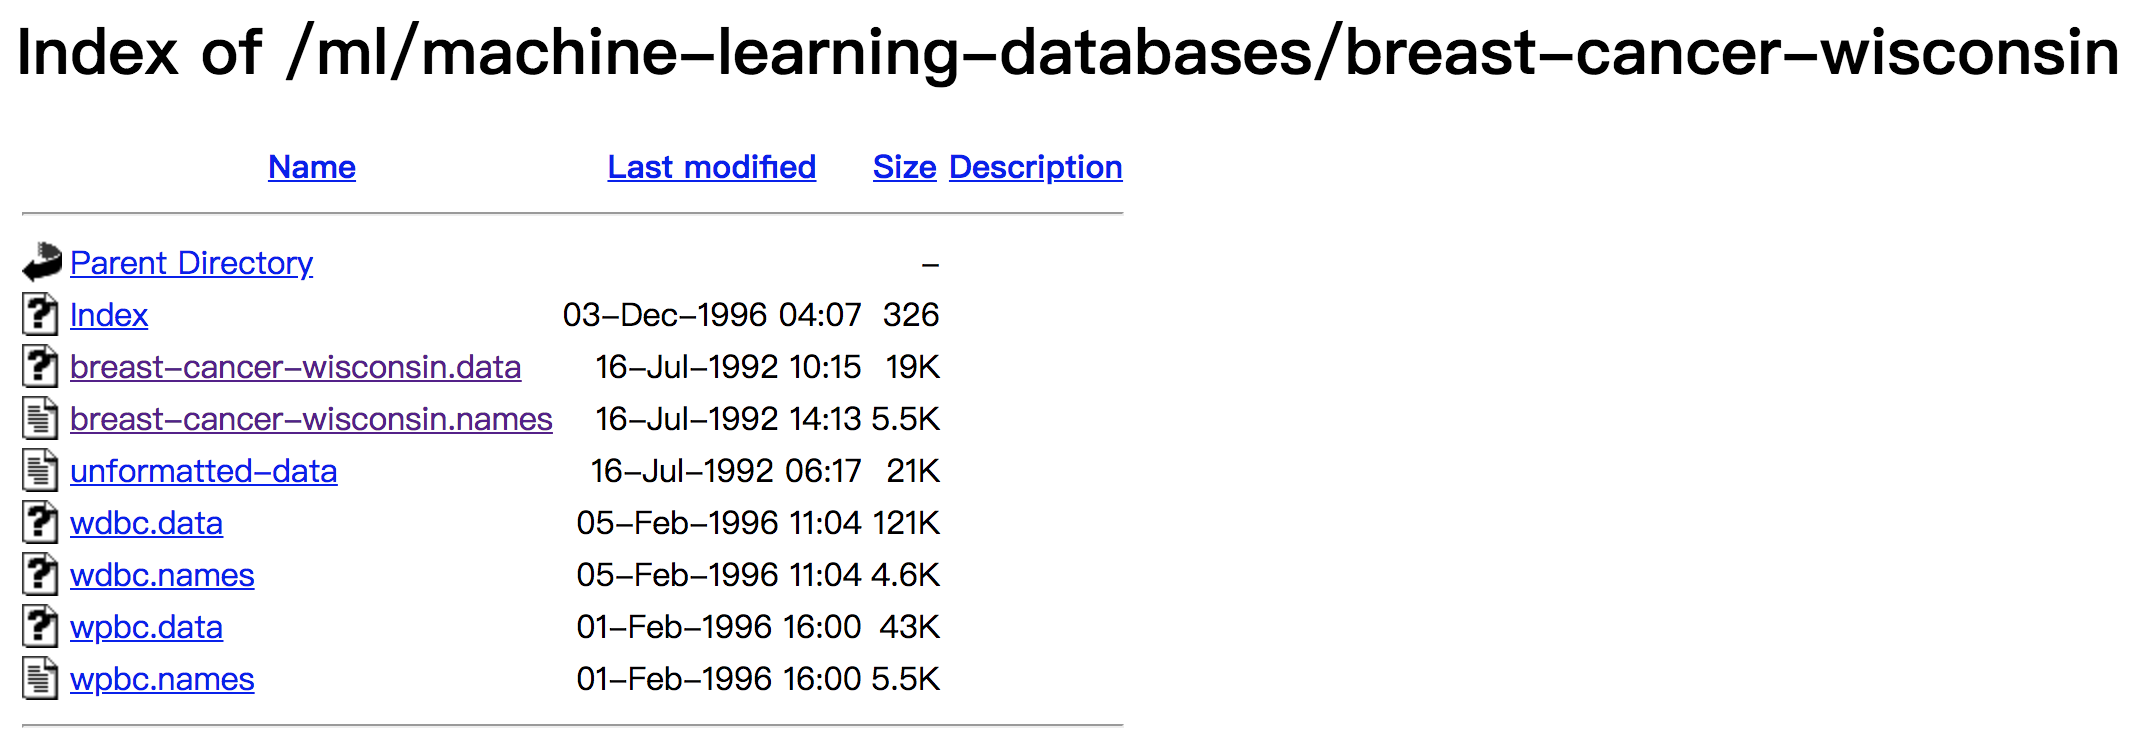
Download address of original data: https://archive.ics.uci.edu/ml/machine-learning-databases/
data description
(1) 699 samples, a total of 11 columns of data, the first column is the search id, and the last 9 columns are related to tumor
The last column represents the value of tumor type.
(2) Contains 16 missing values, use "?" Mark.
1 Analysis
1.get data
2.Basic data processing
2.1 Missing value processing
2.2 Determine eigenvalue,target value
2.3 Split data
3.Characteristic Engineering(Standardization)
4.machine learning(logistic regression )
5.Model evaluation
2 code
import pandas as pd
import numpy as np
from sklearn.model_selection import train_test_split
from sklearn.preprocessing import StandardScaler
from sklearn.linear_model import LogisticRegression

#1: get data
names = ['Sample code number', 'Clump Thickness', 'Uniformity of Cell Size', 'Uniformity of Cell Shape',
                   'Marginal Adhesion', 'Single Epithelial Cell Size', 'Bare Nuclei', 'Bland Chromatin',
                   'Normal Nucleoli', 'Mitoses', 'Class']
data = pd.read_csv("./data/breast-cancer-wisconsin.data",
                  names=names)

#2: Basic data processing
#2.1 Missing value processing
# print(pd.isnull(data)) # Determine whether there are missing values
# print(data.query(''))
data = data.replace(to_replace='?',value=np.NaN)
data = data.dropna() #Delete missing values

x = data.iloc[:,1:10] # characteristic value
# print(x.head())
y = data["Class"]  # target value
# print(y)
#2.2 Split data
x_train,x_test,y_train,y_test = train_test_split(x,y,random_state=22)

#3: Feature Engineering
transfer = StandardScaler()
x_train = transfer.fit_transform(x_train)
x_test = transfer.fit_transform(x_test)

# 4: Machine learning logistic regression
estimator = LogisticRegression()
estimator.fit(x_train,y_train)

#5: Model evaluation
y_predict = estimator.predict(x_test)
print(y_predict)
print(estimator.score(x_test, y_test))


# print(data.head())