Data analysis and mining xgboost&git
git address
git
Upload files to GitHub for the first time
-
Enter the managed folder
-
Open git bash
-
Initialization command
git init
-
View file status in directory
git status

# New or modified files are red
-
Manage specified files (red to green)
git add file name
git add .      # All documents
-
Personal information configuration: user name, mailbox (only once)
git config --global user.email "you@example.com"
git config --global user.name "your name"
-
Build version
git commit -m 'Description information'
-
View version record
git log
-
Connect GitHub
# Now you need to verify with token and ssh
# Alias remote warehouse
git remote add origin Remote warehouse address
# Push code to remote warehouse (main branch by default)
git push -u origin branch
I have uploaded the first version. You just clone my version to get a folder, create a new folder in this folder, complete your tasks and avoid conflicts
Download the code on your computer
# Clone remote warehouse code
git clone Remote warehouse address (no initialization at this time)
# Use mirror
git clone https://github.com.cnpmjs.org/name/project.git
# Put your completed tasks in a folder
# After completing the task
# My code already has two branches, which are cloned. By default, it is in the main branch. We need to switch branches and enter the second branch. My second branch is the dev branch
git checkout dev
git status
git add .
git commit -m "Description information"
# After completing the task, push the code to the remote end
# Note that you only need to push the dev branch to see which branch you are in
git push origin dev  # Only after collaboration can it be uploaded to other people's GitHub
Design of predicting user churn
Application scenario
"""
Application scenario: the business department wants the data Department to analyze the lost users
 For example, what are the most significant characteristics of lost customers? Under what characteristics and conditions, users are more likely to lose behavior and give it to the business department
 Business optimization and recovery actions for these users.
Based on the above requirements: characteristics of data analysis:
This is an analysis of feature extraction. The target deliverables are the importance of features and feature rules
 Decision tree is the best algorithm to interpret rules
 Business departments need to understand the relationship between rules and provide rule diagrams
 There will be sample distribution imbalance in the data probability, because there must be a small number of lost users
"""

"""
Pandas                python      Do data reading and basic processing
sklearn of trian_test_split        The segmentation data set is divided into training set and test set
XGBoost                          Classification algorithm is used for model training and rule processing
sklearn.metrics in            Multiple evaluation indicators XGBoost Effect of model
imblearn.over_sampling              Medium SMOTE Sample equalization in the library
matplotlib                          Graphics output, used with
prettytable                         Table format output display
GraphViz                            The third-party program for vector graph output is python To provide an interface, you need to download and configure environment variables
pydot                               XGBoost Used when displaying tree graphics
"""
Install the necessary libraries
xgboost
'''
Ensemble learning algorithm
	bagging(Random forest)
    boosting(gbdt(xgboost))
    	gbdt Gradient lifting algorithm, xgboost belong to gdbt algorithm

xgboost:Addition model and forward optimization algorithm (it is an integrated learning algorithm of regression tree and classification tree)  	(Multiple weak learners integrated together)
'''
# Download the installation package of the corresponding python version from the website (my version is 3.7, and the installation package has been put into the folder)
# Put the downloaded installation package into the corresponding Python interpreter scripts, such as G:\python_learn\venv\Scripts
# cmd enter Scripts: pip install xgboost-1.2.1-cp37-cp37m-win_amd64.whl (installation package name)
# Installation succeeded
GraphViz
- GraphViz download website
- The installation package has been put into the file case
- You need to configure environment variables to use
- User environment variables are as follows
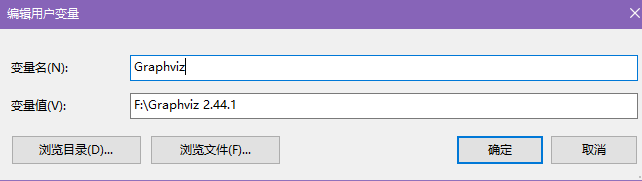
- System environment variables are as follows
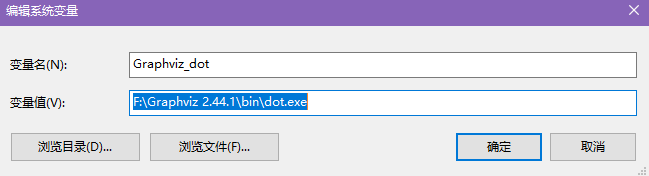
- Add the bin directory of Graphviz under path in the system environment variable

prettytable
pip install prettytable
pydot
pip install pydot
pyecharts
pip install Library name
Problems needing attention
Pretreatment
- xgboost algorithm is tolerant, does not deal with null values, and will deal with them effectively
- xgboost itself can effectively select features and process them without dimensionality reduction
- Although xgboost can not deal with null values, we study the loss of users. There must be a small number of lost customers, and there will be uneven data, so we need to balance the data. The balance processing enforces that there can be no null value, so we need to process the null value
- After the mean processing, a numpy matrix is returned, and the features have been lost. We need to label the data again
Training model
- random_ The state parameter is very important. For the random forest model, it is random in nature. Setting different random states (or not setting the random_state parameter) can completely change the built model
Confusion matrix
- The confusion matrix output is a matrix without any labels. We need to format it and output it
- Confusion matrix drawing
visualization
- The model trained by xgboost comes with some visualization methods. xgb.plot_importance outputs the importance of the feature, xgb.to_graphviz outputs a tree rule graph. These two methods can draw directly by giving the trained model and some parameters, without giving the analyzed data.
- pyechart drawing needs data. By observing the source code, xgboost model can obtain the data obtained after analysis in the following ways
# importance_type = weight is the number of times the feature appears in the tree (the number of splits), gain is the average gain of feature splitting, and cover is the proportion of samples covered as split nodes
importance =model_xgb.get_booster().get_score(
    importance_type='weight', fmap='')
- After getting the analyzed data and processing the data into a certain format, you can draw the Pye charts
Explanation of tree rule diagram
- By analyzing the tree rule chart, we can see that from the upper level to the lower level, with the increase of conditions, the greater the probability of losing users (accurately determining users), the more rules, the less the total sample size covered and the number of lost users
- Leaf (similar to a weak classifier, or a predicted value, a predicted value can be obtained by transforming leaf)
github display picture problem
Show pictures in github folder
- Open the hosts file under hosts: (C:\Windows\System32\drivers\etc)
- Edit with notepad and add the following code
# GitHub Start
#192.30.253.112    github.com
#192.30.253.119    gist.github.com
151.101.184.133    assets-cdn.github.com
151.101.184.133    raw.githubusercontent.com
151.101.184.133    gist.githubusercontent.com
151.101.184.133    cloud.githubusercontent.com
151.101.184.133    camo.githubusercontent.com
151.101.184.133    avatars0.githubusercontent.com
151.101.184.133    avatars1.githubusercontent.com
151.101.184.133    avatars2.githubusercontent.com
151.101.184.133    avatars3.githubusercontent.com
151.101.184.133    avatars4.githubusercontent.com
151.101.184.133    avatars5.githubusercontent.com
151.101.184.133    avatars6.githubusercontent.com
151.101.184.133    avatars7.githubusercontent.com
151.101.184.133    avatars8.githubusercontent.com

 # GitHub End
- Just refresh github
Display pictures in github readme file (written by markdown)
- To create a folder dedicated to storing pictures in the project folder.
- Open the picture in GitHub and copy the web address
- Use this URL when writing and inserting pictures in markdown. GitHub readme file can display pictures
- However, the local readme file cannot display the image because the path cannot be found
- You need to change the blob in the web address to raw, and both can display pictures